Manually creating and launching VMs, containers, and network devices is not the way to go. There are three main reasons why you shouldn’t do this:
- It takes too much time.
- It’s easy to make errors.
- It’s not scalable.
Instead, we should use network automation and orchestration tools. What is this about?
Network automation, in its most simple form, is automating a task, so it runs on its own without human intervention. Here are three examples of tasks that you could automate:
- Reset the OSPF process on three routers.
- Create a new VLAN on all your switches.
- Create a new loopback interface on five routers.
You can automate these tasks with scripts or tools. You could write scripts with:
- Bash: the default login shell on most Linux distributions supports scripting.
- TCL: a scripting language that works on Cisco IOS routers.
- Python: programming language you can use from simple scripts to complex programs.
There are also (open-source) tools you can use for network automation. For example:
- Ansible
- Chef
- Puppet
Ansible is a great tool to start with if you are new to network automation. It’s easy to get started with and very powerful.
What about orchestration? Wikipedia has a good one-liner:
Orchestration is the automated configuration, coordination, and management of computer systems and software.
What does this mean exactly?
With orchestration, we describe what we want, not how we want it. Figuring out how is the orchestration tool’s job.
We can tell the orchestrator what we want through the CLI, GUI, or send YAML/JSON files with our specifications. The orchestrator then takes care of everything, including:
- Translate our request into configuration tasks for our network devices to execute.
- Check which hardware devices have enough resources to meet our request.
- Send the configuration tasks to the hardware device.
- Monitor progress of the tasks we sent to the hardware device.
- Rollback in case of failure.
Other than the initial communication with the orchestrator, there is no human intervention in the entire process. In this lesson, you will see how you can use Ansible for network automation and I’ll demonstrate the Kubernetes orchestrator.
Ansible
Ansible is a network automation or orchestration tool that lets you turn tasks into repeatable playbooks. You can use it for Linux, MacOS, Windows, and Network Devices. There are three types of tasks you can automate:
- Provisioning
- Configuration management
- Application deployment
It’s a great tool to start with to automate repetitive tasks.
Configuration
Let’s look at Ansible in action.
I’ll show you an example of how to manage an Ubuntu server and a Cisco IOS device.
Linux (Ubuntu)
Even if you have never worked with Linux before, you will be able to follow this example.
I have a brand new Ubuntu server with SSH configured. That’s it. I want to manage this server with Ansible from my computer. The only requirement for Ansible on the remote server is Python so let’s install that:
sudo apt-get update && sudo apt-get install python -y
Ansible requires an inventory file where we add the IP address, username, password, and sudo password of the server we want to manage. You can find all the files I use in this lesson in our git repository.
Here’s my inventory file:
ubuntu-test-server ansible_host=10.56.101.21

[all:vars]
ansible_connection=ssh
ansible_user=vmware
ansible_password=vmware
ansible_sudo_pass=vmware
An inventory file like the one I use above is fine for labs but you can’t use it for a production network. First of all, the username, password, and sudo password are clear text so you can never save this file in a version control system (VCS) like Git. Instead, you should configure Ansible to use SSH key-based authentication and enable passwordless sudo for an Ansible username.
To perform an action on the server, we need to create playbooks. A playbook is a YAML file. Let’s create one to update all packages on the server:
- hosts: ubuntu-servers
  become: yes
  tasks:
  - name: upgrade packages
    apt:
      upgrade: yes
      update_cache: yes
Let me walk you through this file:
- We target all “ubuntu-servers” hosts. This matches the entry in my inventory file.
- “become: yes” means we use the sudo command.
- Tasks are the commands we want to run. In this case, we want to upgrade all packages.
Let’s run the playbook:
ansible-playbook -i ./inventory/hosts playbooks/update_upgrade_packages.yml

PLAY [ubuntu-servers]
****************************

TASK [Gathering Facts]
****************************
ok: [ubuntu-test-server]

TASK [upgrade packages]
****************************
[WARNING]: Could not find aptitude. Using apt-get instead.

changed: [ubuntu-test-server]

PLAY RECAP
****************************
ubuntu-test-server         : ok=2    changed=1    unreachable=0    failed=0
Ansible tells me it ran the playbook and the “ok=2” tells me there are no errors. Let’s look at another example. What if I want to install a package? For example, the Apache webserver. Let’s create another playbook:
# Install Apache Webserver
- hosts: ubuntu-servers
  become: yes
  tasks:
  - name: Install Apache
    package:
      name: apache2
      state: present
Let’s run the playbook:
ansible-playbook -i ./inventory/hosts playbooks/install_apache.yml


PLAY [ubuntu-servers]
****************************

TASK [Gathering Facts]
****************************
ok: [ubuntu-test-server]

TASK [Install Apache]
****************************
changed: [ubuntu-test-server]

PLAY RECAP
****************************
ubuntu-test-server         : ok=2    changed=1    unreachable=0    failed=0
Ansible tells me that it went OK and also shows “changed=1” which means it successfully ran the playbook. Ansible checks if a package is already installed. If I run the playbook again, you can see it won’t try to install the package again:
ansible-playbook -i ./inventory/hosts playbooks/install_apache.yml

PLAY [ubuntu-servers]
****************************

TASK [Gathering Facts]
****************************

ok: [ubuntu-test-server]

TASK [Install Apache]
****************************

ok: [ubuntu-test-server]

PLAY RECAP
****************************
ubuntu-test-server         : ok=2    changed=0    unreachable=0    failed=0
In the output above, you see that the number of changes is now 0. Let’s copy a test HTML file to our web server:
ansible-playbook -i ./inventory/hosts playbooks/copy_html_file.yml
PLAY [ubuntu-servers]
****************************

TASK [Gathering Facts]
****************************
ok: [ubuntu-test-server]

TASK [Copy index.html to /var/www/html]

****************************
changed: [ubuntu-test-server]

PLAY RECAP
****************************
ubuntu-test-server         : ok=2    changed=1    unreachable=0    failed=0
Ansible was able to copy our HTML file. Let’s request that webpage:
curl http://10.56.101.21/index.html
<!DOCTYPE html PUBLIC "-//IETF//DTD HTML 2.0//EN">
<HTML>
   <HEAD>
      <TITLE>
         A Small Hello
      </TITLE>
   </HEAD>
<BODY>
   <H1>Hi</H1>
   <P>This is very minimal "hello world" HTML document.</P>
</BODY>
</HTML>
Excellent. Our web server is up and running and we are able to request our test HTML page.
Cisco
What about Cisco devices? Let’s try Ansible in combination with four Cisco Catalyst IOS switches.
Here is my inventory file:
[distribution]
DSW1 ansible_host=172.16.1.101
DSW2 ansible_host=172.16.1.102

[access]
ASW1 ansible_host=172.16.1.103
ASW2 ansible_host=172.16.1.104

[campus:children]
distribution
access

[all:vars]
ansible_user=admin
ansible_password=cisco
I have two distribution layer switches called DSW1 and DSW2. We also have two access layer switches called ASW1 and ASW2. The four switches together make up the campus network. To keep it simple, I specify the SSH username and password in my inventory file. This is fine for a lab but don’t use this on a production network.
Let’s see if I can run the
show ip interface brief command through Ansible on all switches. Here is the playbook:---
- hosts: campus
gather_facts: no
connection: local
tasks:
- name: Configure credentials
set_fact:
provider:
host: "{{ ansible_host }}"
username: "{{ ansible_user }}"
password: "{{ ansible_password }}"
- name: RUN 'show ip interface brief'
ios_command:
provider: "{{ provider }}"
commands:
- show ip interface brief
register: ip_interfaces
- debug: var=ip_interfaces.stdout_lines
Let’s run it:
ansible-playbook -i ./inventory/hosts playbooks/show_ip_interface_brief.yml

PLAY [campus]
****************************

TASK [Configure credentials]
****************************

ok: [DSW1]
ok: [DSW2]
ok: [ASW1]
ok: [ASW2]

TASK [RUN 'show ip interface brief']
****************************

ok: [ASW1]
ok: [ASW2]
ok: [DSW2]
ok: [DSW1]

TASK [debug]
****************************

ok: [DSW1] => {
    "ip_interfaces.stdout_lines": [
        [
            "Interface              IP-Address      OK? Method Status                Protocol",
            "GigabitEthernet0/0     172.16.1.101    YES NVRAM  up                    up      ",
            "GigabitEthernet0/1     unassigned      YES unset  up                    up      ",
            "GigabitEthernet0/2     unassigned      YES unset  up                    up      ",
            "GigabitEthernet0/3     unassigned      YES unset  up                    up      ",
            "GigabitEthernet1/0     unassigned      YES unset  up                    up      ",
            "GigabitEthernet1/1     unassigned      YES unset  up                    up      ",
            "GigabitEthernet1/2     unassigned      YES unset  up                    up      ",
            "Loopback0              unassigned      YES unset  up                    up"
        ]
    ]
}
ok: [DSW2] => {
    "ip_interfaces.stdout_lines": [
        [
            "Interface              IP-Address      OK? Method Status                Protocol",
            "GigabitEthernet0/0     172.16.1.102    YES NVRAM  up                    up      ",
            "GigabitEthernet0/1     unassigned      YES unset  up                    up      ",
            "GigabitEthernet0/2     unassigned      YES unset  up                    up      ",
            "GigabitEthernet0/3     unassigned      YES unset  up                    up      ",
            "GigabitEthernet1/0     unassigned      YES unset  up                    up      ",
            "GigabitEthernet1/1     unassigned      YES unset  up                    up      ",
            "GigabitEthernet1/2     unassigned      YES unset  up                    up      ",
            "Loopback0              unassigned      YES unset  up                    up"
        ]
    ]
}
ok: [ASW1] => {
    "ip_interfaces.stdout_lines": [
        [
            "Interface              IP-Address      OK? Method Status                Protocol",
            "GigabitEthernet0/0     172.16.1.103    YES NVRAM  up                    up      ",
            "GigabitEthernet0/1     unassigned      YES unset  up                    up      ",
            "GigabitEthernet0/2     unassigned      YES unset  up                    up      ",
            "GigabitEthernet0/3     unassigned      YES unset  up                    up      ",
            "GigabitEthernet1/0     unassigned      YES unset  up                    up"
        ]
    ]
}
ok: [ASW2] => {
    "ip_interfaces.stdout_lines": [
        [
            "Interface              IP-Address      OK? Method Status                Protocol",
            "GigabitEthernet0/0     172.16.1.104    YES NVRAM  up                    up      ",
            "GigabitEthernet0/1     unassigned      YES unset  up                    up      ",
            "GigabitEthernet0/2     unassigned      YES unset  up                    up      ",
            "GigabitEthernet0/3     unassigned      YES unset  up                    up      ",
            "GigabitEthernet1/0     unassigned      YES unset  up                    up      ",
            "Loopback0              unassigned      YES unset  up                    up"
        ]
    ]
}

PLAY RECAP
****************************

ASW1                       : ok=3    changed=0    unreachable=0    failed=0
ASW2                       : ok=3    changed=0    unreachable=0    failed=0
DSW1                       : ok=3    changed=0    unreachable=0    failed=0
DSW2                       : ok=3    changed=0    unreachable=0    failed=0
Very nice. We see the output of the
show ip interface brief command on all four switches. Let’s try something more advanced. How about a playbook that does three things:- Create a backup of the running-configuration and save it to a local folder on our computer.
- Configure the Google DNS servers.
- Configure an NTP server.
Here’s the playbook:
- hosts: campus
  gather_facts: no
  connection: local

  tasks:

  - name: Configure credentials
    set_fact:
      provider:
        host: "{{ ansible_host }}"
        username: "{{ ansible_user }}"
        password: "{{ ansible_password }}"

  - name: Backup Configuration
    ios_config:
      provider: "{{ provider }}"
      backup: yes

  - name: RUN 'Set DNS'
    ios_config:
      provider: "{{ provider }}"
      lines:
        - ip name-server 8.8.8.8
        - ip name-server 8.8.4.4

  - name: RUN 'Set NTP'
    ios_config:
      provider: "{{ provider }}"
      lines:
        - ntp server nl.pool.ntp.org
Let’s run this playbook:
ansible-playbook -i ./inventory/hosts playbooks/configure_ntp_dns.yml

PLAY [campus]
****************************

TASK [Configure credentials]
****************************

ok: [DSW1]
ok: [DSW2]
ok: [ASW1]
ok: [ASW2]

TASK [Backup Configuration]
****************************

ok: [ASW1]
ok: [ASW2]
ok: [DSW1]
ok: [DSW2]

TASK [RUN 'Set DNS']
****************************

changed: [ASW1]
changed: [DSW2]
changed: [ASW2]
changed: [DSW1]

TASK [RUN 'Set NTP']
****************************

changed: [ASW1]
changed: [DSW2]
changed: [ASW2]
changed: [DSW1]

PLAY RECAP
****************************

ASW1                       : ok=4    changed=2    unreachable=0    failed=0
ASW2                       : ok=4    changed=2    unreachable=0    failed=0
DSW1                       : ok=4    changed=2    unreachable=0    failed=0
DSW2                       : ok=4    changed=2    unreachable=0    failed=0
Ansible tells us it changed all four switches. Let’s verify this:
DSW1#show run | include server
ip name-server 8.8.8.8
ip name-server 8.8.4.4
ntp server nl.pool.ntp.org
Excellent. We see the commands we ran through our playbook.
You have now seen some simple examples of how you can use Ansible. You don’t have to build your playbooks from scratch. There are many pre-built roles that you can add to your playbooks.
In my Ubuntu web server example we installed the Apache web server and uploaded an HTML file. That’s only part of the story though. There are many steps required to run a web server in production. Instead of building your own playbook, you can try one of the apache roles.
Kubernetes
Google uses containers for pretty much everything they run: Gmail, Google Apps, GSuite, YouTube, etc. At Google’s scale, they really need orchestration.
Google published a paper in 2015 about Borg, their internal orchestration system for containers.
Kubernetes is an open-source orchestration platform for containers. It’s built from the ground up with the best ideas from Borg. You can use Kubernetes in the cloud or bare metal environments.
There are other container orchestration platforms like Docker Swarm but Kubernetes has won the battle. Even Docker Desktop nowadays includes support for Kubernetes.
Nodes and Pods
Let’s look at an overview of how Kubernetes works. Take a look at the following picture:

A Kubernetes cluster is a collection of nodes. A node is a physical server or VM. A pod is a collection of one or more containers. The containers in the pod together make up an application. For example, a simple website could use two containers in one pod:
- nginx: web server software to process HTTP requests.
- php-fpm: software to process PHP files.
A pod is the smallest entity that Kubernetes can schedule. Even if you use a single container, it will always be in a pod. Each pod has a single IP address and containers in the pod communicate with each other with the localhost (127.0.0.1) IP address. We can start, stop, or replicate pods.
Services
Kubernetes pods are replaceable. When a pod crashes, we don’t resurrect it but we replace it instead. When a node crashes, the Kubernetes cluster creates new pods on other nodes to return to the desired cluster state. We can also replicate pods to scale up our application. This is useful for a website application that suddenly receives more user traffic.
Each pod has a unique IP address ,but how do we figure out what pods are available and what their IP addresses are?
A Kubernetes service defines a set of pods and a policy how we can access the pods. Here is a picture to help you visualize this:
 A service is linked to a set of pods. We can connect through the service on TCP port 10080 and the traffic is forwarded to the pods that listen on TCP port 80.
Cluster
A Kubernetes cluster consists of multiple components. Here is an overview picture:
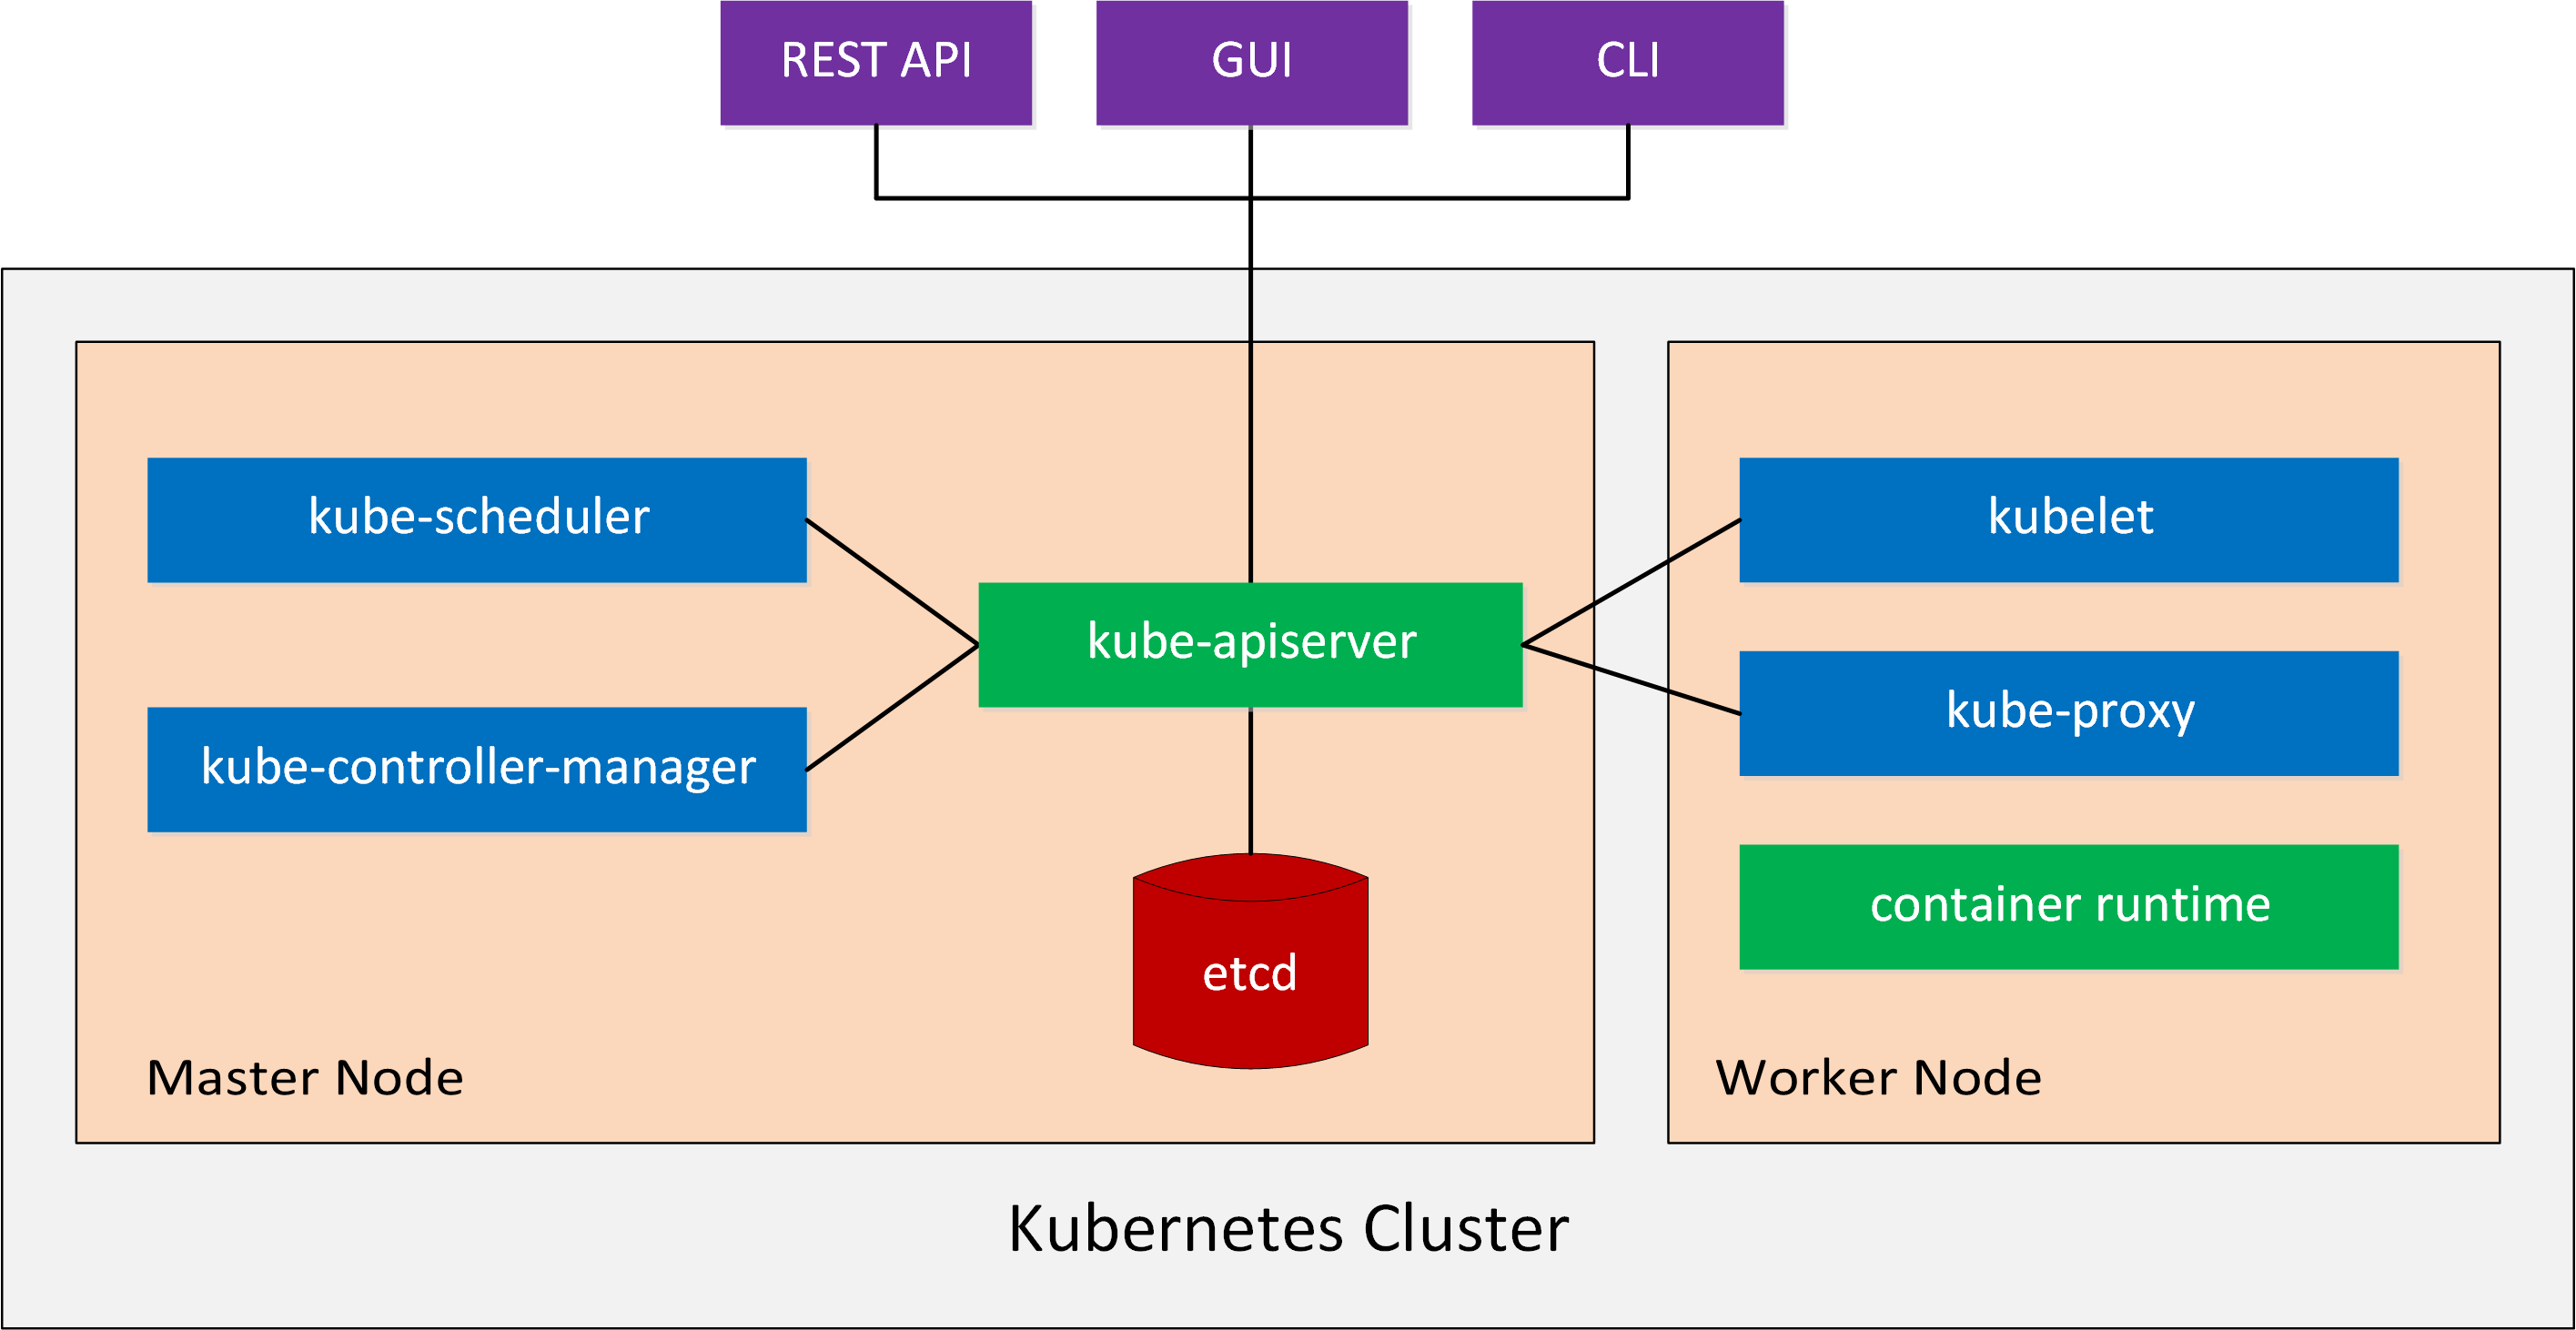
Let’s talk about the master and worker components.
Master Components
The master node is the control plane of a Kubernetes cluster.
There are four master components that provide the cluster’s control plane. These master components are responsible for everything that happens in the cluster. For example, scheduling new pods or detecting and responding to cluster events. Let’s take a closer look at these four master components:
- kube-apiserver: This component exposes the Kubernetes API. This is the front end of our control plane.
- etcd: Etcd is the key-value store we use to store all Kubernetes cluster data.
- kube-scheduler: The kube-scheduler component monitors newly created pods and selects a node for them to run on.
- kube-controller-manager: This component runs controllers. A controller monitors the state of the cluster through the API and if needed, makes changes to move the current cluster state to the desired cluster state. An example of a controller is the “node controller”. This controller is responsible for monitoring and responding when nodes go down.
Node Components
The node components run on all master and worker nodes. They maintain running pods and provide the Kubernetes runtime environment. There are three node components:
- kubelet: Kubelet is the agent that receives the configuration for a pod through the API and makes sure that the containers are running in a pod and in a healthy state.
- kube-proxy: Kube-proxy is a network proxy and proxies UDP, TCP, and SCTP connections. It’s responsible for connection forwarding and provides load balancing.
- container runtime: The container runtime is the software responsible for running the containers, also known as the container engine. Docker is the default and most popular option but Kubernetes also supports rkt, runc, and anything else based on the OCI Runtime Specification.
Addons
There are also addons that add features to our Kubernetes cluster. Here are four examples:
- DNS: Each Kubernetes cluster should have a DNS server. The Kubernetes cluster creates DNS records for pods and services. Containers in the Kubernetes cluster also use the DNS server for their DNS lookups.
- Web UI Dashboard: The dashboard is a web-based Kubernetes user interface. You can use this to monitor and manage your cluster.
- Container Resource Monitoring: Container resource monitoring records resource metrics from containers in a central database. There are many tools out there you can use to monitor your Kubernetes cluster. Cloud providers like Google Cloud offer their own tools. The most popular open-source solution is Prometheus.
- Cluster-level Logging: Application and system logs are important for understanding what is going on in the cluster. Container engines like Docker offer a mechanism you can use to read container logs. Kubernetes can read these logs but nodes and pods can disappear. A Kubernetes cluster should have a native storage solution that exports log files to a central location. Kubernetes has no native storage solution for data but there are many logging solutions that integrate with Kubernetes.
Networking
Kubernetes networking can be complex because there are many parts involved. Take a look at the following picture:
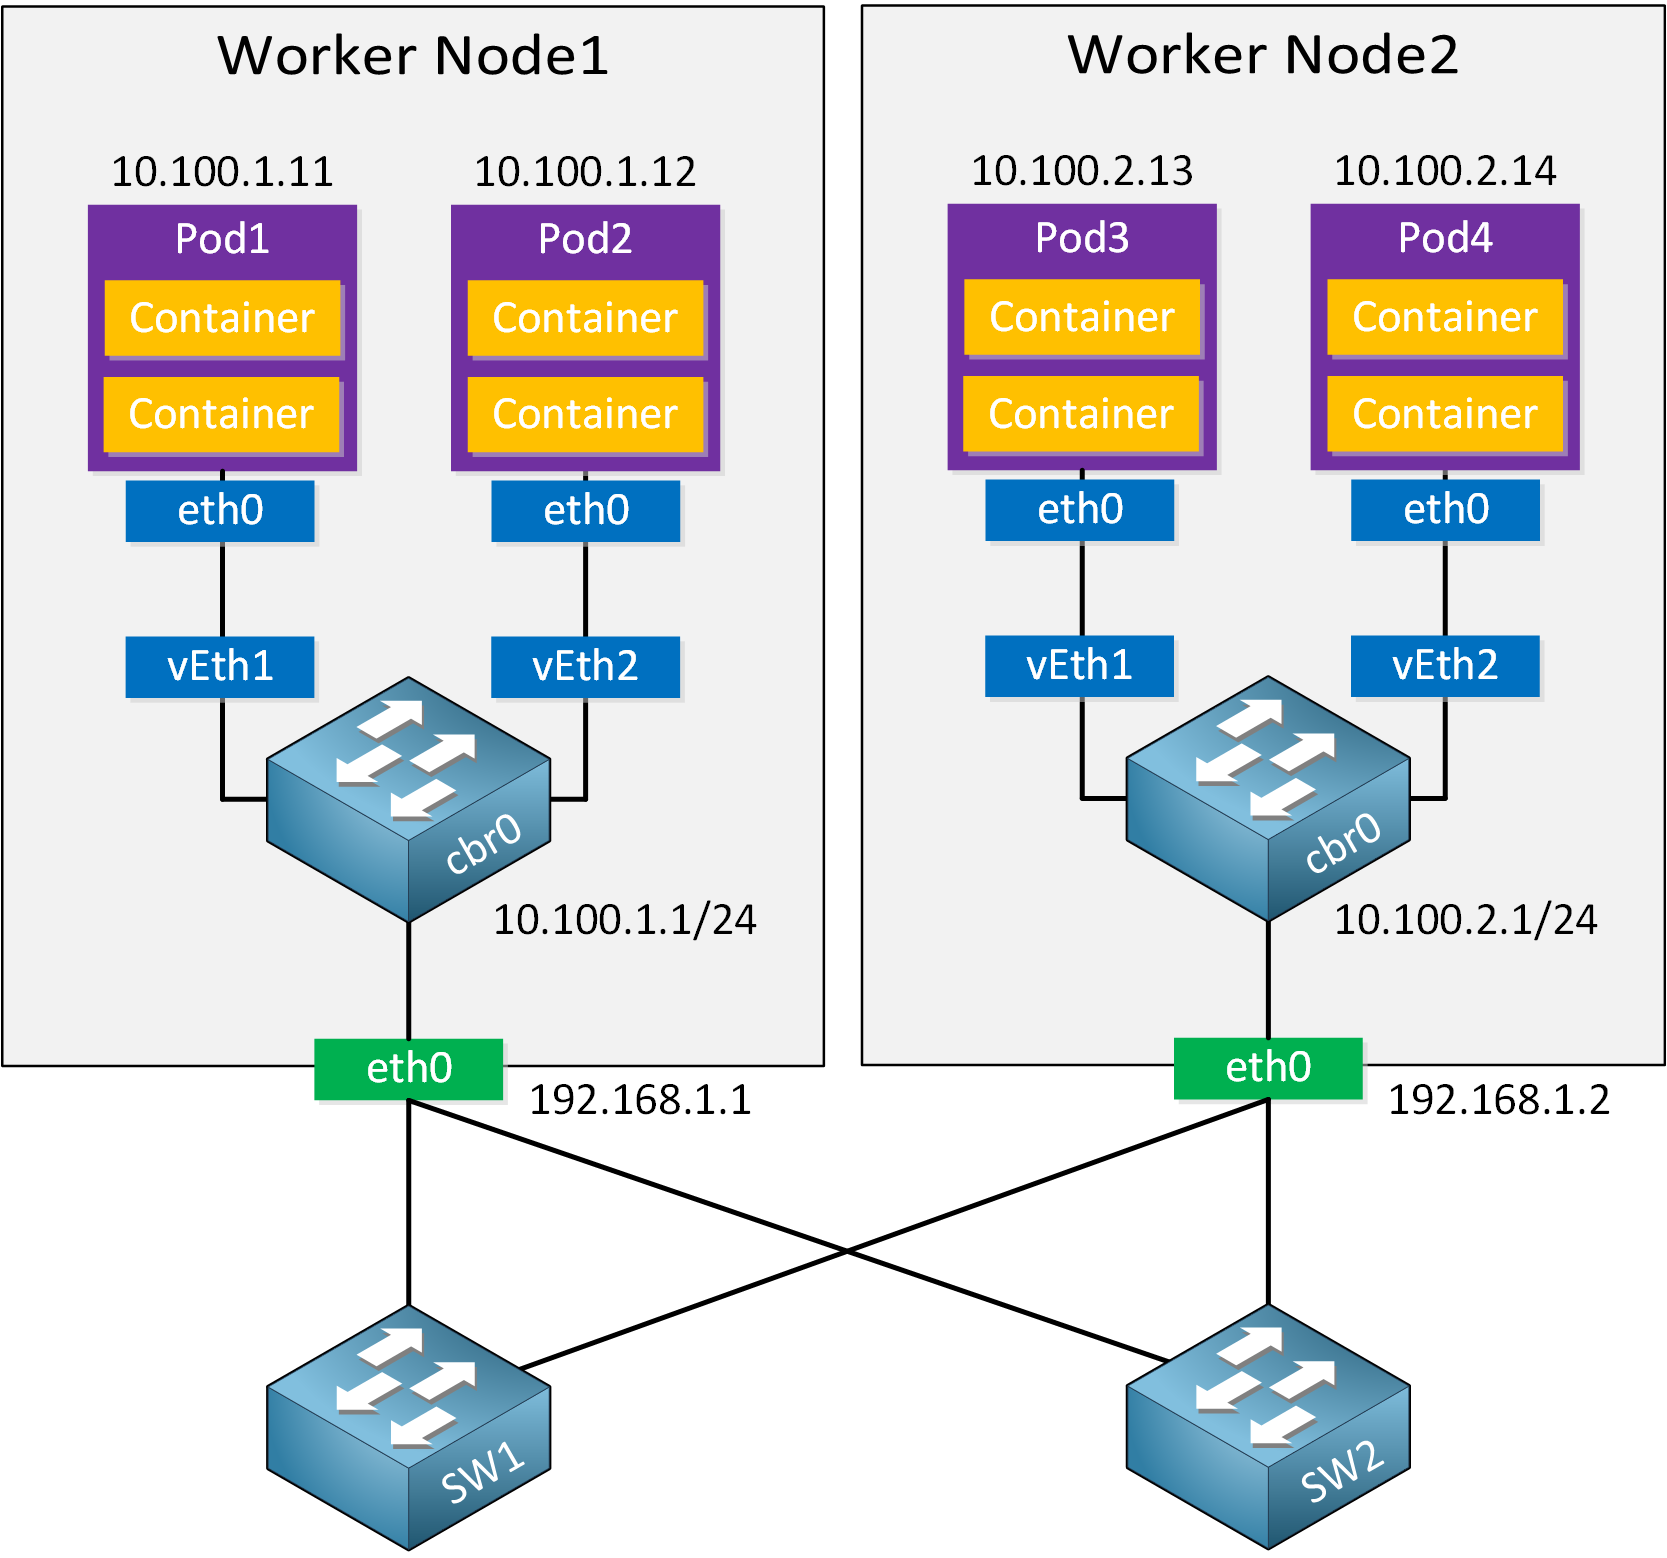
Each pod has a single eth0 interface and a single IP address. Within the pod, containers communicate with each other using the localhost (127.0.0.1) address. The pods connect to a virtual switch called cbr0, and the virtual switch connects to the physical interface.
There are four Kubernetes networking problems to solve:
- container-to-container
- pod-to-pod
- pod-to-service
- external-to-service
Container-to-container communication is solved by using the localhost address. Containers can communicate with each other directly. Pod-to-service and external-to-service are a story for another day. Explaining these two is outside the scope of this lesson.
Pod-to-pod is something we should discuss. As explained in the Cloud Connectivity lesson, Docker uses a virtual bridge called docker0 and assigns an RFC1918 private address block to this bridge. Each container has a virtual Ethernet (veth) interface attached to the bridge. The veth interface appears as eth0 in the container and has an IP address from the bridge’s address space.
Docker containers can talk with each other if they are on the same host because they have an IP address in the same address space. Containers on different machines can’t talk with each other. The virtual bridges are isolated from each other and it’s also possible that they have overlapping address space.
There are options to make Docker containers on different hosts talk with each other. One of them is to use IPTables and NAT to forward ports. This isn’t a scalable solution so Kubernetes uses a different approach to container networking.
Kubernetes imposes the following requirements on any networking implementation:
- All containers can communicate with all other containers without NAT.
- All nodes can communicate with all containers (and vice versa) without NAT.
- The IP address that a container sees itself as is the same IP that others see it as.
There are several ways to implement these requirements and thus, there are multiple solutions.
Kubernetes uses Container Network Interface (CNI) as an interface between network providers and Kubernetes networking. CNI consists of a specification and libraries to write plugins for container network interfaces.
There are many different CNI providers to choose from to implement Kubernetes networking. We have open-source, cloud provider, and vendor options. Here are six examples:
- Cisco ACI
- Flannel
- Calico
- WeaveNet
- Google Compute Engine (GCE)
- Amazon VPC CNI
Demo
Enough talk about Kubernetes. Let’s look at it in action.
If you want to learn Kubernetes, a great place to start is Katacoda. They offer free walkthroughs where you can try things on an actual Kubernetes cluster.
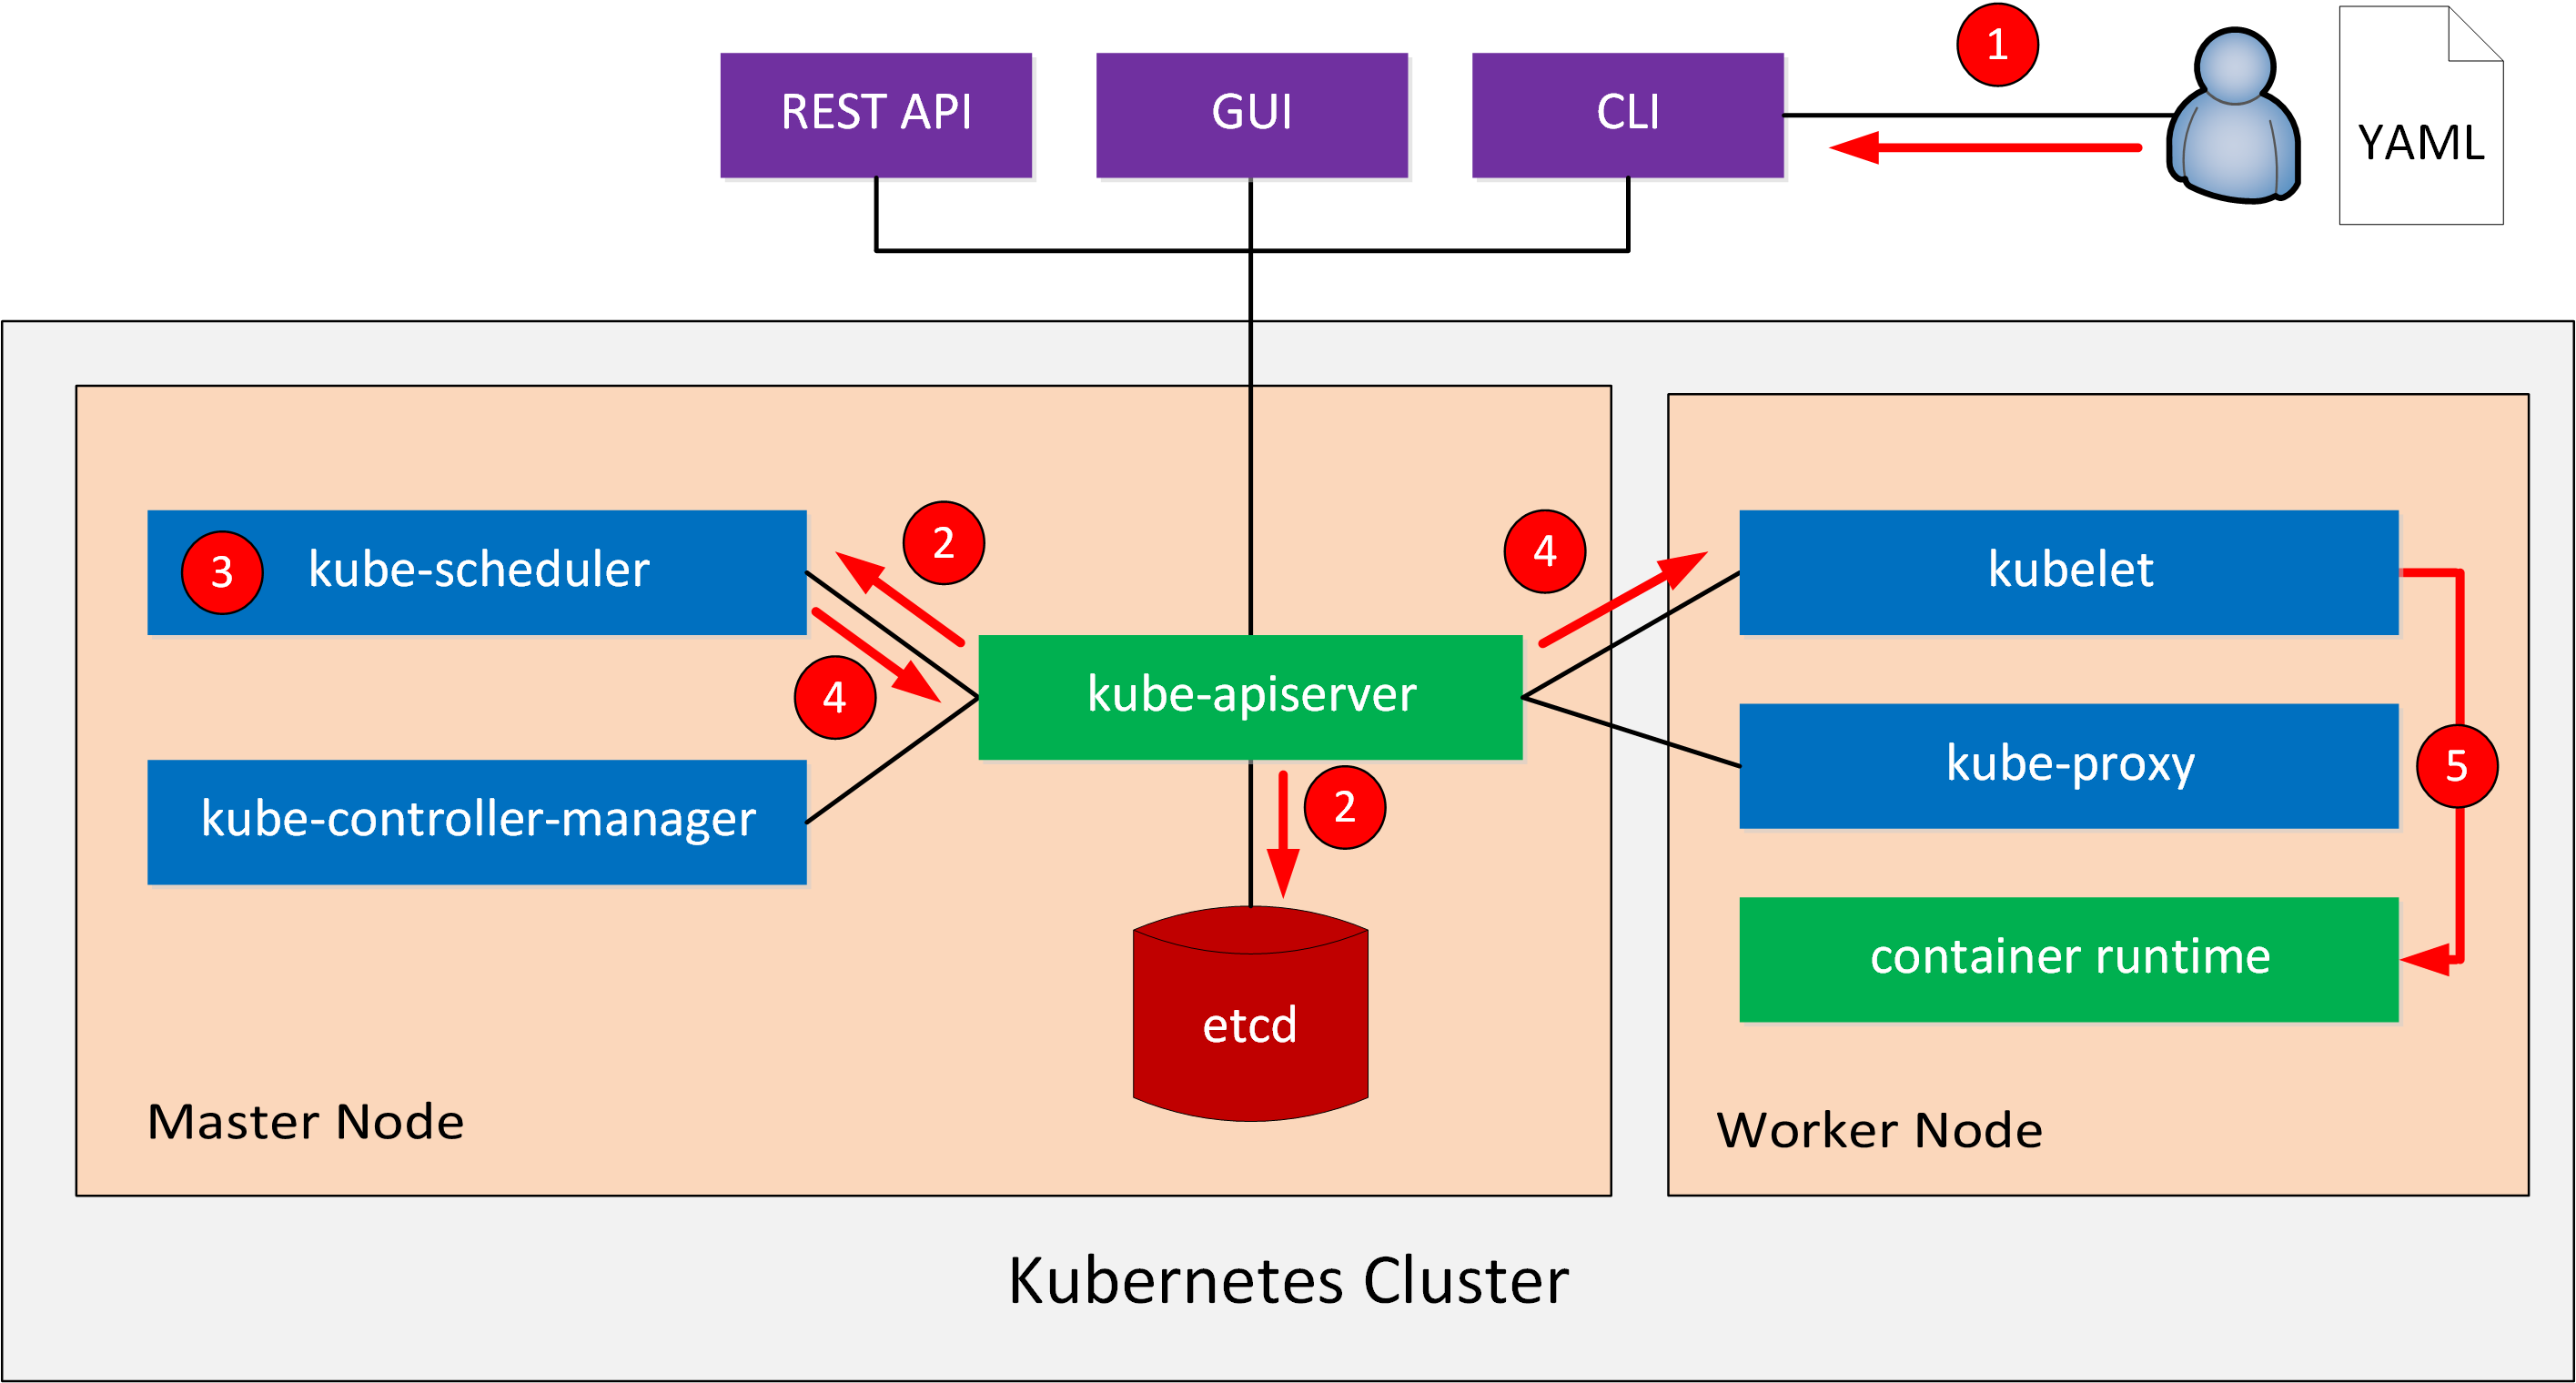
Here is a high level overview of what we will do:
- We create a YAML or JSON deployment file. This configuration file has instructions with the containers and images we want to use.
- We send the deployment file to the API server with the Kubernetes dashboard GUI or CLI.
- It sends the deployment information to the scheduler and stores in etcd.
- The scheduler figures out what to create based on our deployment configuration file. The number of pods, how many CPU cores or memory the pod needs, etc.
- The scheduler selects one or more nodes that match the criteria.
- The scheduler sends a message to kubelet on the node with the requirements of the pod.
- Kubelet communicates with Docker and instructs it to download the container image, create the containers, etc.
Here is a picture to help you visualize this process:
Let’s see this in action. I will use the CLI tool called kubectl. Let’s see how many nodes this cluster has:
kubectl get nodes
NAME       STATUS    ROLES     AGE       VERSION
minikube   Ready     <none>    57s       v1.10.0
This cluster has a single node. Are there any pods?
kubectl get pods
No resources found.
There are no pods so let’s create something. A deployment is a Kubernetes object where we describe what containers we want to use in our pod, and how many pods we want to use. We can use a YAML file for this:
apiVersion: extensions/v1beta1
kind: Deployment
metadata:
  name: web-application
spec:
  replicas: 1
  template:
    metadata:
      labels:
        app: web-application
    spec:
      containers:
      - name: nginx
        image: nginx:1.15-alpine
        ports:
        - containerPort: 80
      - name: php-fpm
        image: php:7-fpm-alpine3.8
This deployment creates a pod called “web application” with two containers called “nginx” and “php-fpm”. You can find the deployment file in our gitlab repository.
Let’s create this deployment:
kubectl apply -f deployment-web-application.yml
deployment.extensions/web-application created
We can verify whether our deployment is successful or not:
kubectl get deployment
NAME              DESIRED   CURRENT   UP-TO-DATE   AVAILABLE   AGE
web-application   1         1         1            1           58s
Great. We see the desired and current state is 1. Let’s take a closer look at this deployment:
kubectl describe deployment web-application
Name:                   web-application
Namespace:              default
CreationTimestamp:      Tue, 22 Jan 2019 13:50:41 +0000
Labels:                 app=web-application
Annotations:            deployment.kubernetes.io/revision=1
Selector:               app=web-application
Replicas:               1 desired | 1 updated | 1 total | 1 available | 0 unavailable
StrategyType:           RollingUpdate
MinReadySeconds:        0
RollingUpdateStrategy:  1 max unavailable, 1 max surge
Pod Template:
  Labels:  app=web-application
  Containers:
   nginx:
    Image:        nginx:1.15-alpine
    Port:         80/TCP
    Host Port:    0/TCP
    Environment:  <none>
    Mounts:       <none>
   php-fpm:
    Image:        php:7-fpm-alpine3.8
    Port:         <none>
    Host Port:    <none>
    Environment:  <none>
    Mounts:       <none>
  Volumes:        <none>
Conditions:
  Type           Status  Reason
  ----           ------  ------
  Available      True    MinimumReplicasAvailable
  Progressing    True    NewReplicaSetAvailable
OldReplicaSets:  <none>
NewReplicaSet:   web-application-6984bc6f5c (1/1 replicas created)
Events:
  Type    Reason             Age   From                   Message
  ----    ------             ----  ----                   -------
  Normal  ScalingReplicaSet  16s   deployment-controller  Scaled up replica set web-application-6984bc6f5c to 1
Above, we see the details of our deployment including the name of the pod and the two containers. Let’s look at the pod:
kubectl get pod
NAME                               READY     STATUS    RESTARTS   AGE
web-application-6984bc6f5c-vg988   2/2       Running   0          36s
Above, we see the name of our deployment with some random characters and letters to create a unique pod name. The 2/2 ready status means that our two containers in the pod are up and running. Let’s inspect this pod:
kubectl describe pod
Name:           web-application-6984bc6f5c-vg988
Namespace:      default
Node:           minikube/172.17.0.11
Start Time:     Tue, 22 Jan 2019 13:50:41 +0000
Labels:         app=web-application
                pod-template-hash=2540672917
Annotations:    <none>
Status:         Running
IP:             172.18.0.4
Controlled By:  ReplicaSet/web-application-6984bc6f5c
Containers:
  nginx:
    Container ID:   docker://48084a028d303f752f56ce9861dfa70b4497491a5fce4b4bd438cef6b12d1c63
    Image:          nginx:1.15-alpine
    Image ID:       docker-pullable://nginx@sha256:385fbcf0f04621981df6c6f1abd896101eb61a439746ee2921b26abc78f45571
    Port:           80/TCP
    Host Port:      0/TCP
    State:          Running
      Started:      Tue, 22 Jan 2019 13:50:41 +0000
    Ready:          True
    Restart Count:  0
    Environment:    <none>
    Mounts:
      /var/run/secrets/kubernetes.io/serviceaccount from default-token-s44v7 (ro)
  php-fpm:
    Container ID:   docker://4ead35eb10c06672ad8598834469e66695cf29f742693b433484716a11444456
    Image:          php:7-fpm-alpine3.8
    Image ID:       docker-pullable://php@sha256:31ab4dbf82b35c0d78b4fd2d4a1872df4b18051921bab8e0319d6d0bb255f7f4
    Port:           <none>
    Host Port:      <none>
    State:          Running
      Started:      Tue, 22 Jan 2019 13:50:42 +0000
    Ready:          True
    Restart Count:  0
    Environment:    <none>
    Mounts:
      /var/run/secrets/kubernetes.io/serviceaccount from default-token-s44v7 (ro)
Conditions:
  Type           Status
  Initialized    True
  Ready          True
  PodScheduled   True
Volumes:
  default-token-s44v7:
    Type:        Secret (a volume populated by a Secret)
    SecretName:  default-token-s44v7
    Optional:    false
QoS Class:       BestEffort
Node-Selectors:  <none>
Tolerations:     node.kubernetes.io/not-ready:NoExecute for 300s
                 node.kubernetes.io/unreachable:NoExecute for 300s
Events:
  Type    Reason                 Age   From               Message
  ----    ------                 ----  ----               -------
  Normal  Scheduled              1m    default-scheduler  Successfully assigned web-application-6984bc6f5c-vg988 tominikube
  Normal  SuccessfulMountVolume  1m    kubelet, minikube  MountVolume.SetUp succeeded for volume "default-token-s44v7"
  Normal  Pulled                 1m    kubelet, minikube  Container image "nginx:1.15-alpine" already present on machine
  Normal  Created                1m    kubelet, minikube  Created container
  Normal  Started                1m    kubelet, minikube  Started container
  Normal  Pulled                 1m    kubelet, minikube  Container image "php:7-fpm-alpine3.8" already present on machine
  Normal  Created                1m    kubelet, minikube  Created container
  Normal  Started                1m    kubelet, minikube  Started container
The output above tells us that the pod is up and running. What if we want to change our deployment? For example, let’s scale up the number of pods from 1 to 4. I can change my deployment file:
apiVersion: extensions/v1beta1
kind: Deployment
metadata:
  name: web-application
spec:
  replicas: 4
  template:
    metadata:
      labels:
        app: web-application
    spec:
      containers:
      - name: nginx
        image: nginx:1.15-alpine
        ports:
        - containerPort: 80
      - name: php-fpm
        image: php:7-fpm-alpine3.8
And reapply the yaml deployment file:
kubectl apply -f deployment-web-application.yml
deployment.extensions/web-application configured
Kubernetes will now create more pods. We can track this with the following command:
kubectl rollout status
Waiting for deployment "web-application" rollout to finish: 1 of 4 updated replicas are available...
Waiting for deployment "web-application" rollout to finish: 2 of 4 updated replicas are available...
Waiting for deployment "web-application" rollout to finish: 3 of 4 updated replicas are available...
deployment "web-application" successfully rolled out
Let’s see if our deployment has four pods:
kubectl get deployment
NAME              DESIRED   CURRENT   UP-TO-DATE   AVAILABLE   AGE
web-application   4         4         4            4           7m
The desired and current state of our deployment is four. Let’s check the pods:
kubectl get pods
NAME                               READY     STATUS    RESTARTS   AGE
web-application-6984bc6f5c-dsbkq   2/2       Running   0          34s
web-application-6984bc6f5c-hp7j6   2/2       Running   0          34s
web-application-6984bc6f5c-ksd2d   2/2       Running   0          34s
web-application-6984bc6f5c-vg988   2/2       Running   0          4m
Excellent. We now have four running pods. Let’s try something else. What if we want to change the image of one of our containers? For example, let’s switch from PHP 7.0 to 7.3. I’ll update my deployment file:
kind: Deployment
metadata:
  name: web-application
spec:
  replicas: 4
  template:
    metadata:
      labels:
        app: web-application
    spec:
      containers:
      - name: nginx
        image: nginx:1.15-alpine
        ports:
        - containerPort: 80
      - name: php-fpm
        image: php:7.3-fpm-alpine3.8
Let’s reapply the deployment file again:
kubectl apply -f deployment-web-application.yml
deployment.extensions/web-application configured
Check the status:
kubectl rollout status
Waiting for deployment "web-application" rollout to finish: 2 out of 4 new replicas have been updated...
Waiting for deployment "web-application" rollout to finish: 2 out of 4 new replicas have been updated...
Waiting for deployment "web-application" rollout to finish: 2 out of 4 new replicas have been updated...
Waiting for deployment "web-application" rollout to finish: 3 out of 4 new replicas have been updated...
Waiting for deployment "web-application" rollout to finish: 3 out of 4 new replicas have been updated...
Waiting for deployment "web-application" rollout to finish: 3 out of 4 new replicas have been updated...
Waiting for deployment "web-application" rollout to finish: 3 out of 4 new replicas have been updated...
Waiting for deployment "web-application" rollout to finish: 3 out of 4 new replicas have been updated...
Waiting for deployment "web-application" rollout to finish: 3 out of 4 new replicas have been updated...
Waiting for deployment "web-application" rollout to finish: 1 old replicas are pending termination...
Waiting for deployment "web-application" rollout to finish: 3 of 4 updated replicas are available...
deployment "web-application" successfully rolled out
Kubernetes has multiple rollout strategies. In this case, it creates new pods and then terminates the old pods. We now have four pods running the PHP 7.3 image:
kubectl get pods
NAME                               READY     STATUS    RESTARTS   AGE
web-application-77c7494658-cgbtz   2/2       Running   0          1m
web-application-77c7494658-nrlp9   2/2       Running   0          1m
web-application-77c7494658-rggq7   2/2       Running   0          1m
web-application-77c7494658-tfsks   2/2       Running   0          1m
Earlier I explained that containers in a pod can communicate with each other through localhost. Let’s find out if this is true or not.
With the kubectl command, I can run commands within a container. Let’s open the shell of the php-fpm container of one of my pods:
kubectl exec -it web-application-77c7494658-cgbtz -c php-fpm sh
Once you run this command, you’ll be inside the php-fpm container. The nginx container listens on TCP port 80. Let’s try to connect to it:
curl http://localhost:80 | grep Welcome
  % Total    % Received % Xferd  Average Speed   Time    Time     Time  Current
                                 Dload  Upload   Total   Spent    Left  Speed
  0     0    0     0    0     0      0      0 --:--:-- --:--:-- --:--:--     0
Welcome to nginx!
100   612  100   612    0     0   199k      0 --:--:-- --:--:-- --:--:--  199k
This works. It proves that containers within a pod can communicate through localhost.
Another cool thing that Kubernetes does is monitor containers. When a process in a container dies, Kubernetes replaces the container. Let’s test this.
Within the php-fpm container, I’ll kill the php-fpm process. To do this, I need to look up the process number of the php-fpm process:
ps aux | grep php-fpm
    1 root      0:00 php-fpm: master process (/usr/local/etc/php-fpm.conf)
    5 www-data  0:00 php-fpm: pool www
    6 www-data  0:00 php-fpm: pool www
   19 root      0:00 grep php-fpm
Let’s kill the main process (1):
kill 1
The container is now terminated. You’ll see the following message:
command terminated with exit code 137
If you are quick, you’ll be able to see that only one out of two containers is running:
kubectl get pod web-application-77c7494658-cgbtz
NAME                               READY     STATUS      RESTARTS   AGE
web-application-77c7494658-cgbtz   1/2       Completed   0          5m
A few seconds later, Kubernetes will replace the failed container:
kubectl get pod web-application-77c7494658-cgbtz
NAME                               READY     STATUS    RESTARTS   AGE
web-application-77c7494658-cgbtz   2/2       Running   1          46s
The ready status shows two out of two containers again and the number of restarts is now one.
What if we delete an entire pod? Let’s try that:
kubectl delete pod web-application-77c7494658-cgbtz
pod "web-application-77c7494658-cgbtz" deleted
Kubernetes will replace the failed pod almost immediately:
kubectl get pod
NAME                               READY     STATUS    RESTARTS   AGE
web-application-77c7494658-flhnx   2/2       Running   0          32s
web-application-77c7494658-nrlp9   2/2       Running   0          7m
web-application-77c7494658-rggq7   2/2       Running   0          7m
web-application-77c7494658-tfsks   2/2       Running   0          7m
That’s all about Kubernetes for now. These examples show the power of container orchestration. Kubernetes launches pods based on our deployment file and does everything it can to keep containers up and running.
Cisco CloudCenter
Cisco CloudCenter (formerly known as cliQr) is an application orchestration tool for application deployment on a variety of infrastructures. You can deploy applications on your on-premises data center, public clouds, or private clouds. Cloud providers offer different services and each provider has their strengths and weaknesses. As a customer, you want to use the best services from each provider. For example:
- Google Cloud for Kubernetes
- Amazon AWS for S3 file storage
- Microsoft Azure for Active Directory
Managing each cloud directly through a GUI, CLI, or API can be a pain. Each cloud provider has different APIs, GUIs, and CLI tools so you have to learn how to work with all of them.
CloudCenter provides a single point for application deployment. You create applications through CloudCenter, then deploy them on the infrastructure of choice.
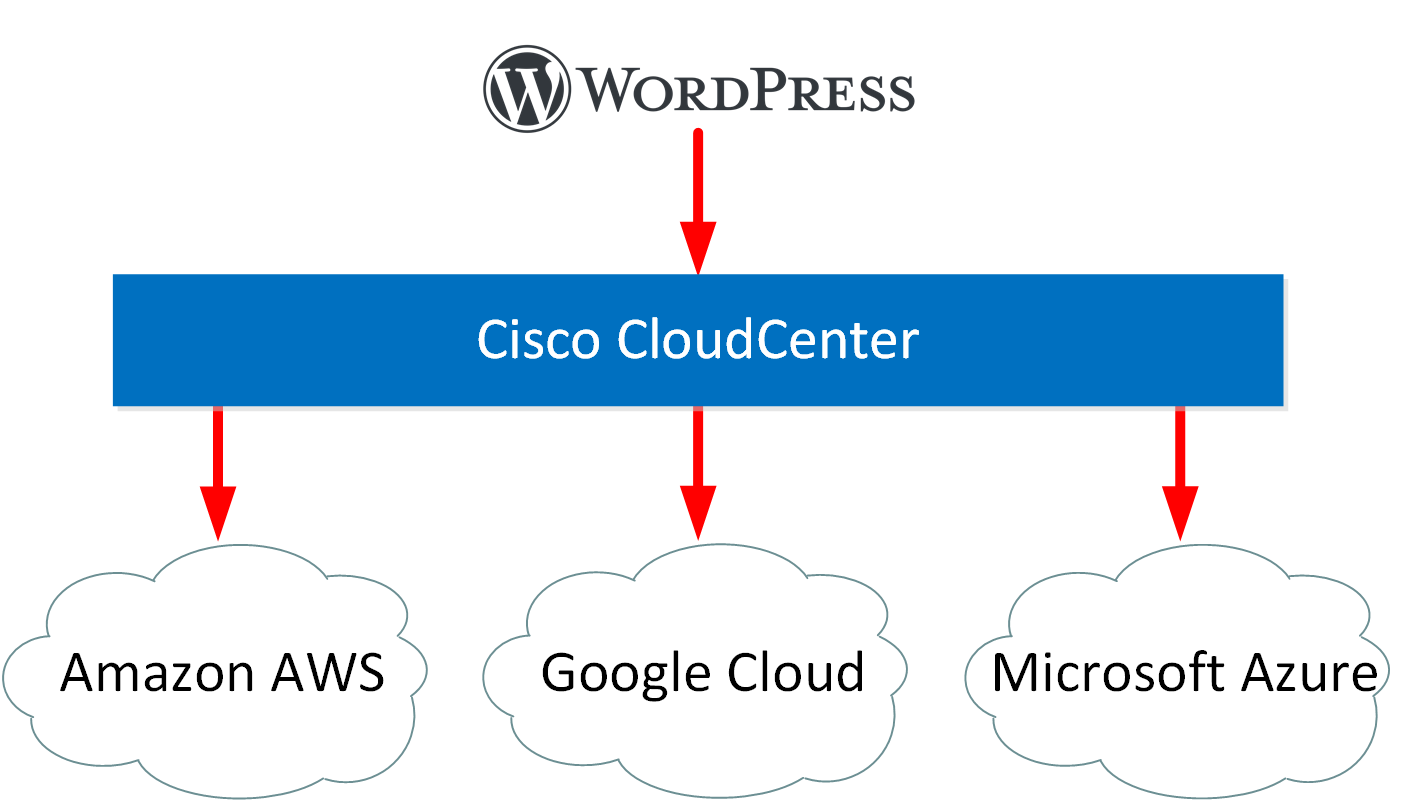
CloudCenter abstracts the application from the cloud. It knows how the APIs work of all possible cloud providers and infrastructure endpoints. You create applications through CloudCenter and don’t have to worry about how each individual cloud provider works. This makes it easier to implement a multicloud strategy.
There are two components in CloudCenter:
- Cisco CloudCenter Manager (CCM)
- Cisco CloudCenter Orchestrator (CCO)
CCM is the interface for users and administrators. You can access it through the web browser, CLI, or a REST API. This is where users can deploy applications and where administrators model (create) applications. Administrators also configure policies and rules. CCM calls application blueprints application profiles. You can click and drag the components you require for your application, which I’ll show in a short demo.
CCM connects to CCOs. CloudCenter deploys an orchestrator in each data center or cloud you want to use. CCO receives information from CCM and orchestrates the deployment of the application profiles.
Demo
Let’s look at CloudCenter in action. First, I’ll show you how an end user can deploy applications and secondly, I’ll show you how an administrator can add/edit an application profile.
End User
An end user can see all available application profiles:
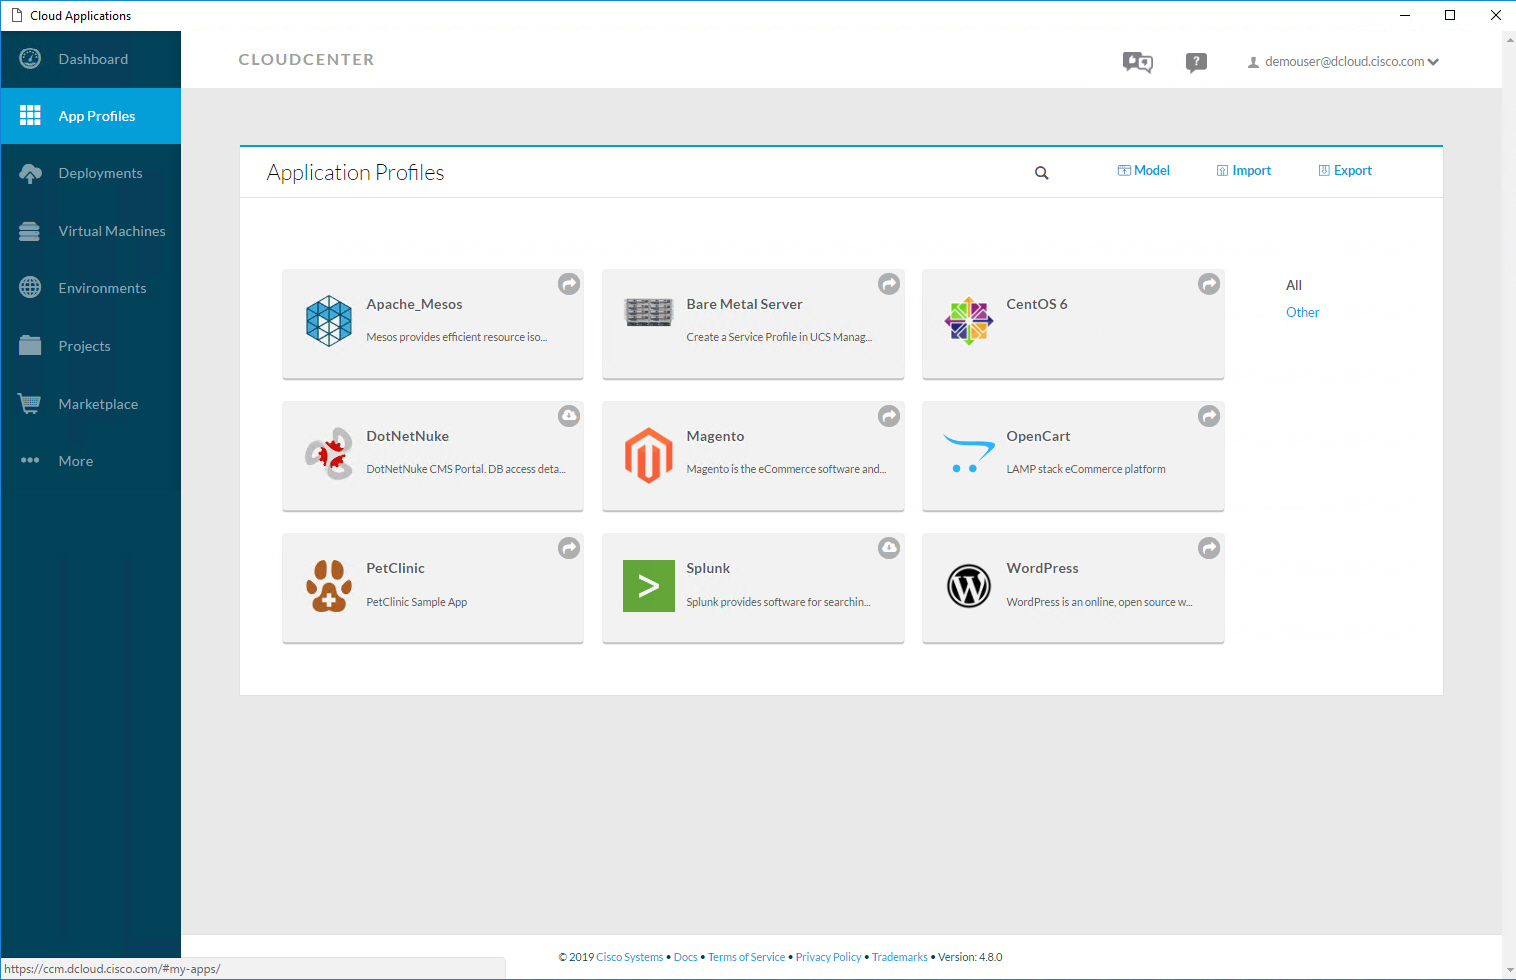
Let’s deploy WordPress. Once you click on the icon, you see the following screenshot:
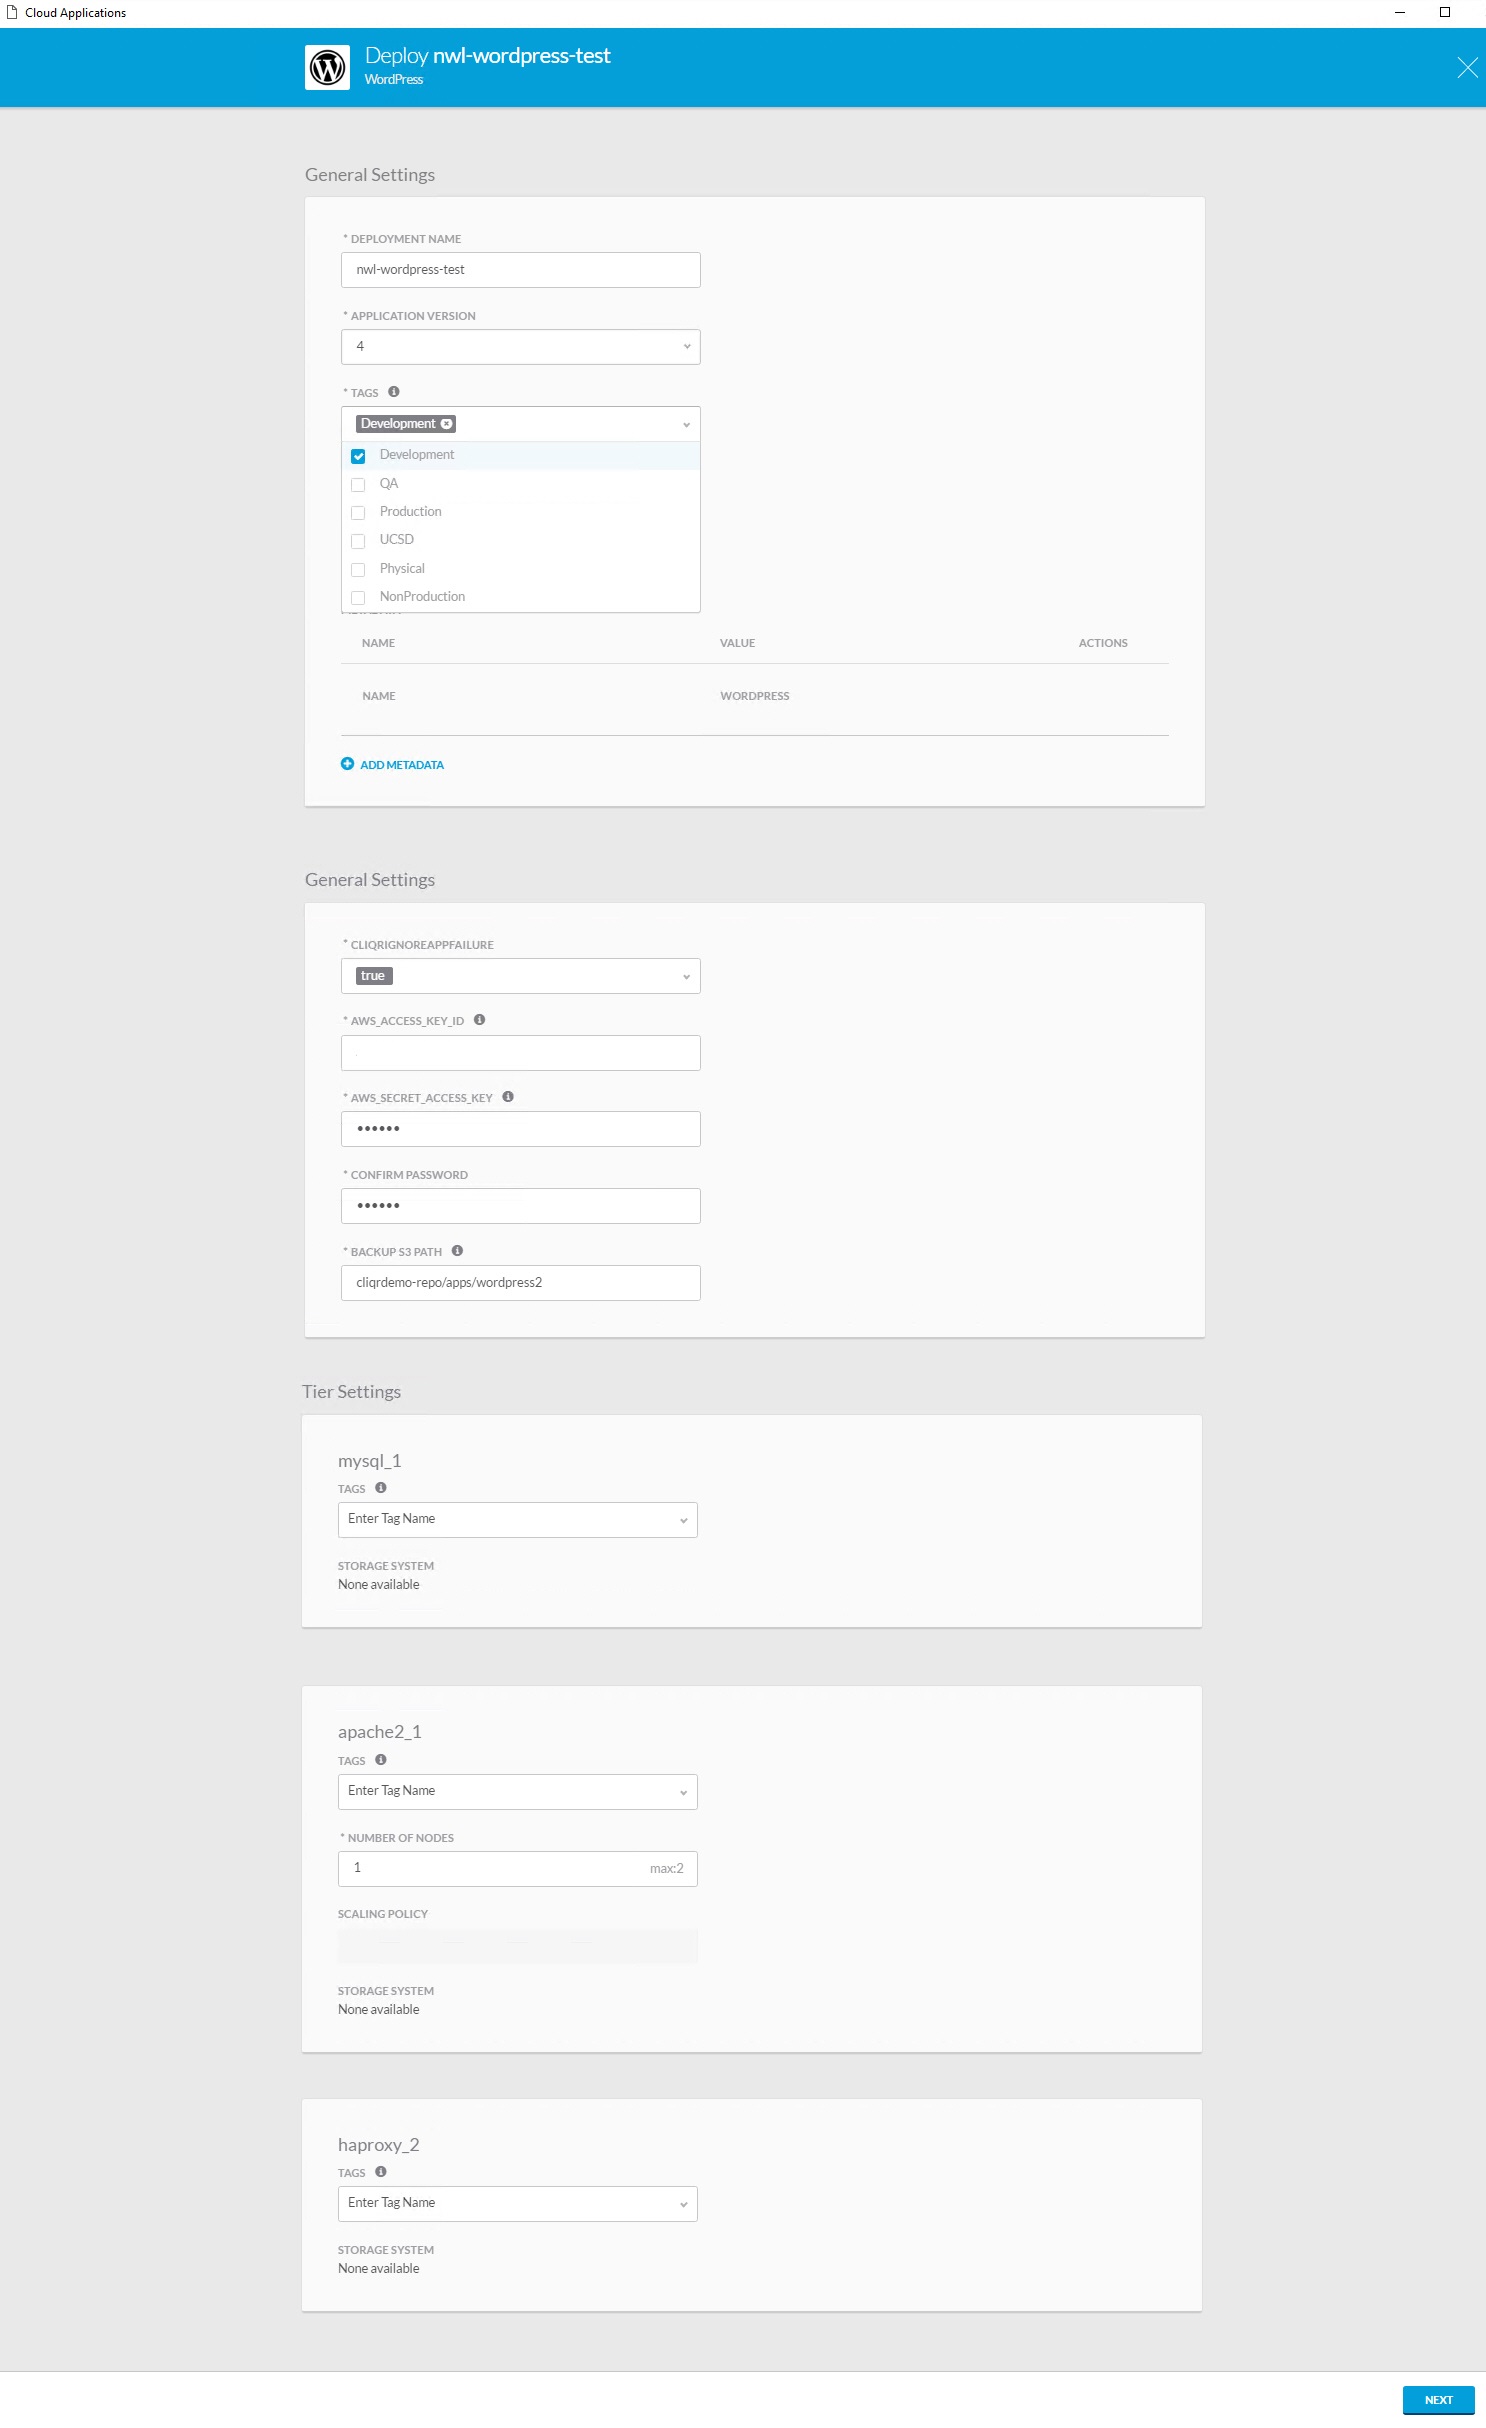
I can choose a name, version, and add tags if needed. Administrators can link policies to different tags. For example, applications with the “production” tag can scale up or down if needed. Applications with the “development” tag can’t scale at all.
You can also see the components that make up my application. In this case, we have MySQL, Apache, and HAProxy. We click Next to continue and see the following screen:
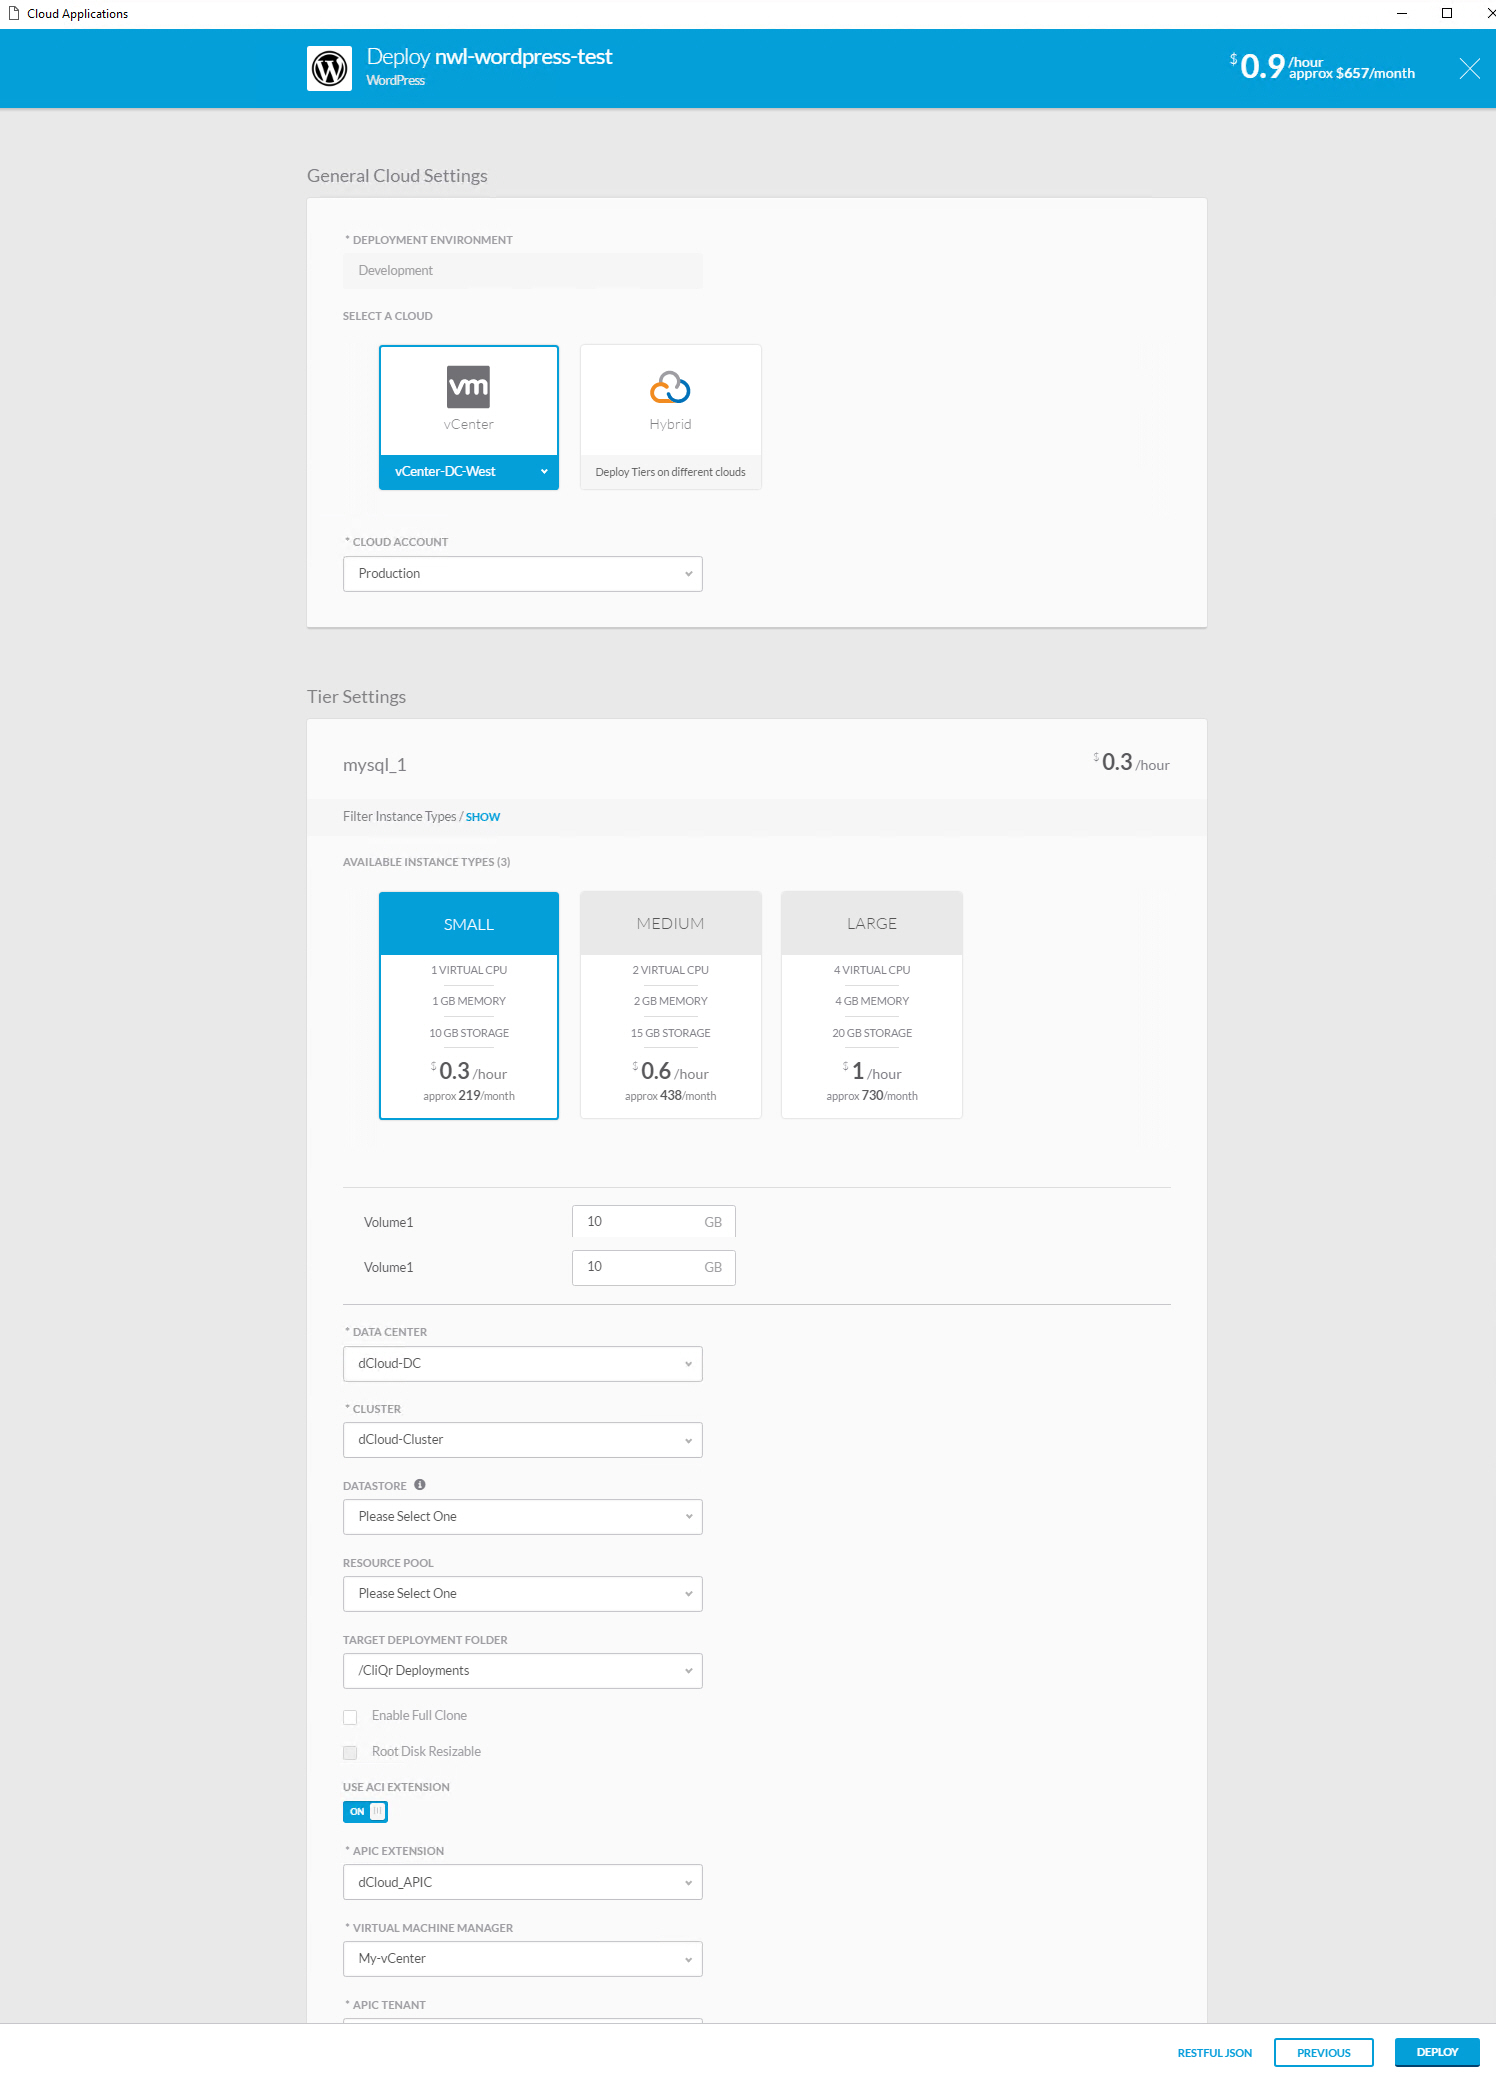
Above, we can select the cloud we want to use and it shows the instance type for each component. In this example, the MySQL server will run on a virtual machine with one core and 1 GB of memory. Once we are ready, we can hit the deploy button. After a few minutes, we can see the deployment in the deployments section:

You can click on the deployment to see details:
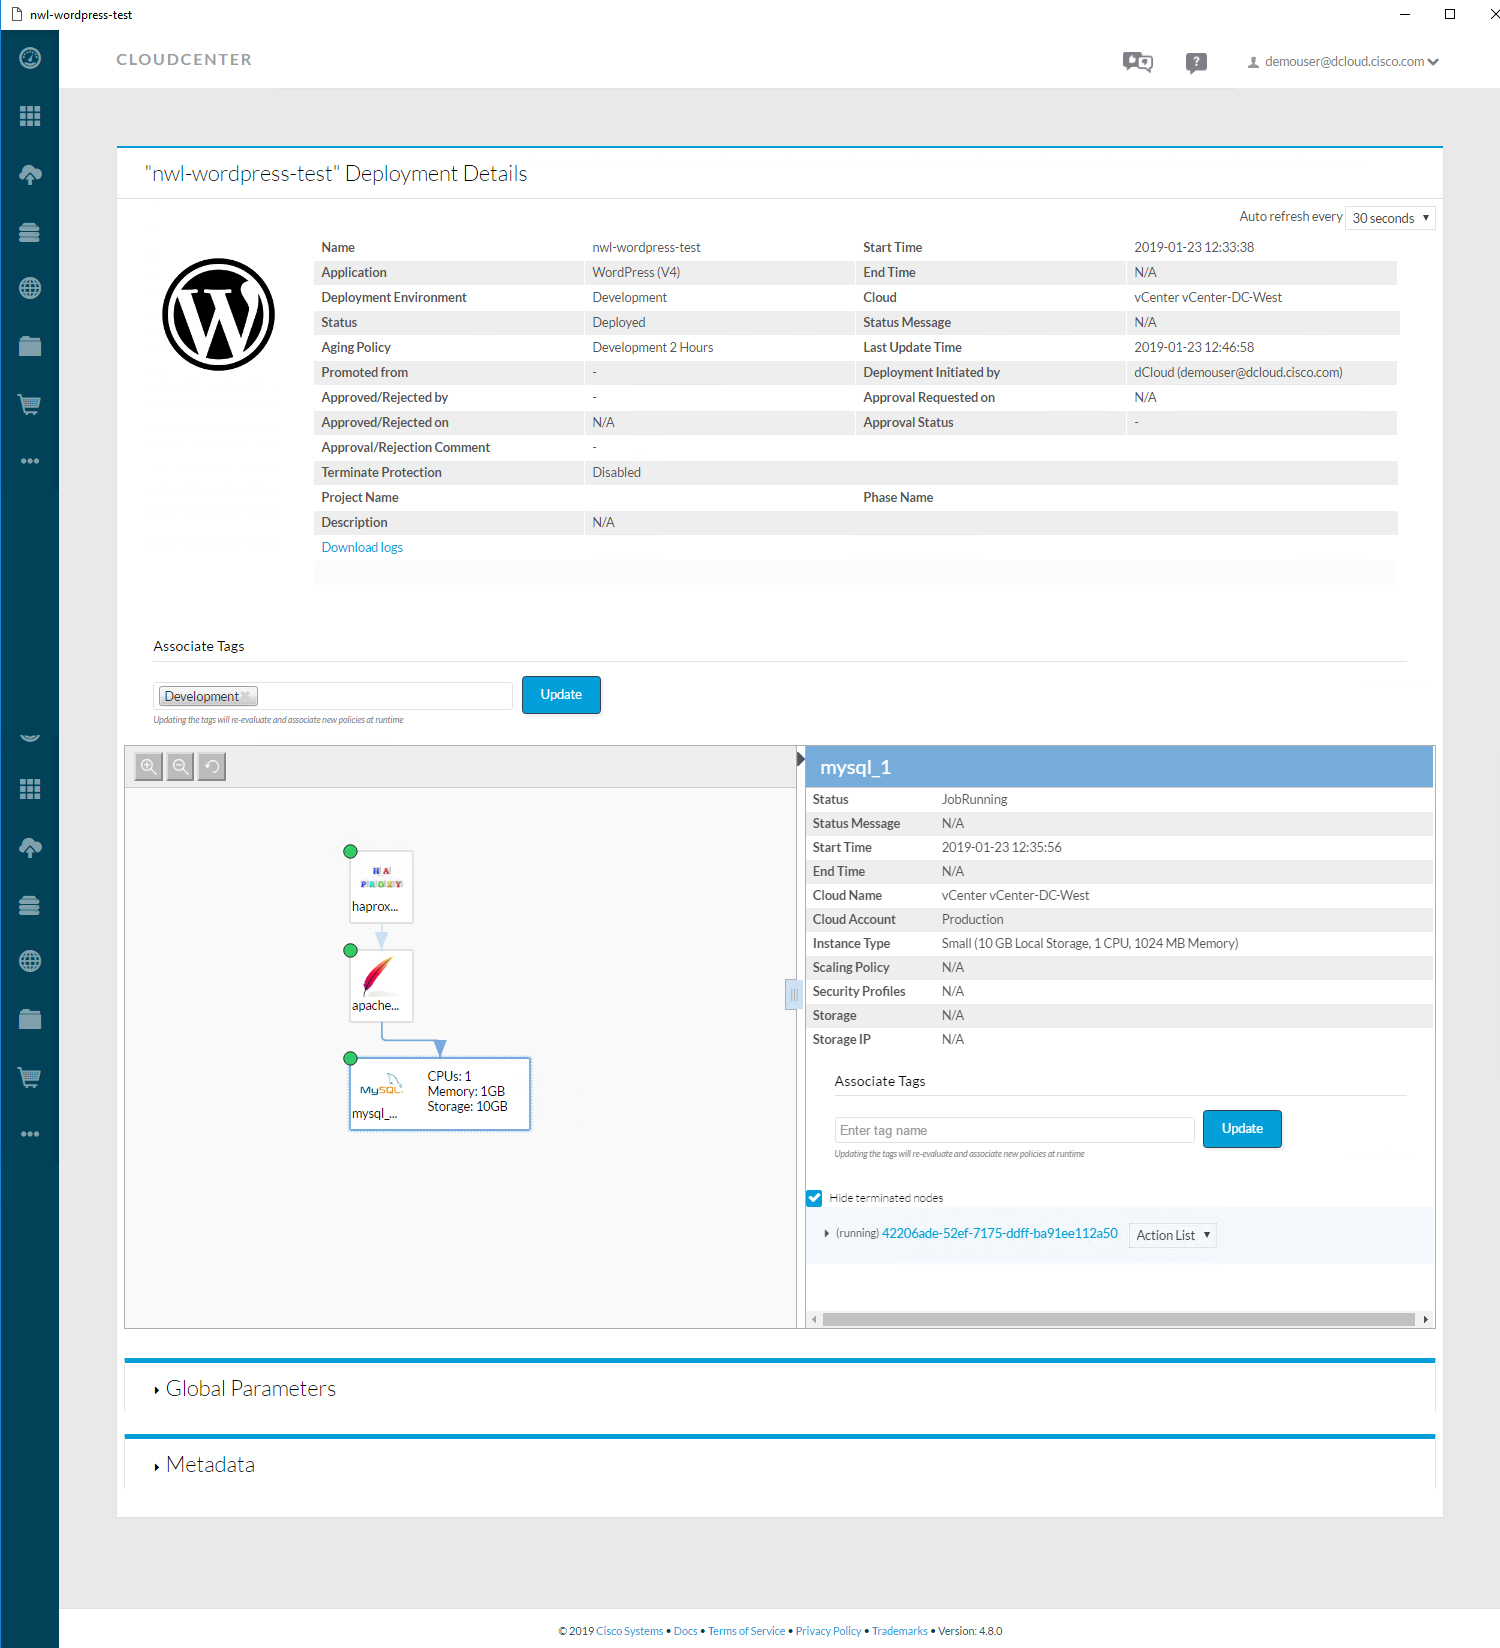
I can click on each component and it will show me some details. Above, we see that the MySQL server runs on a VMWare instance. You can get an overview of all virtual machines:
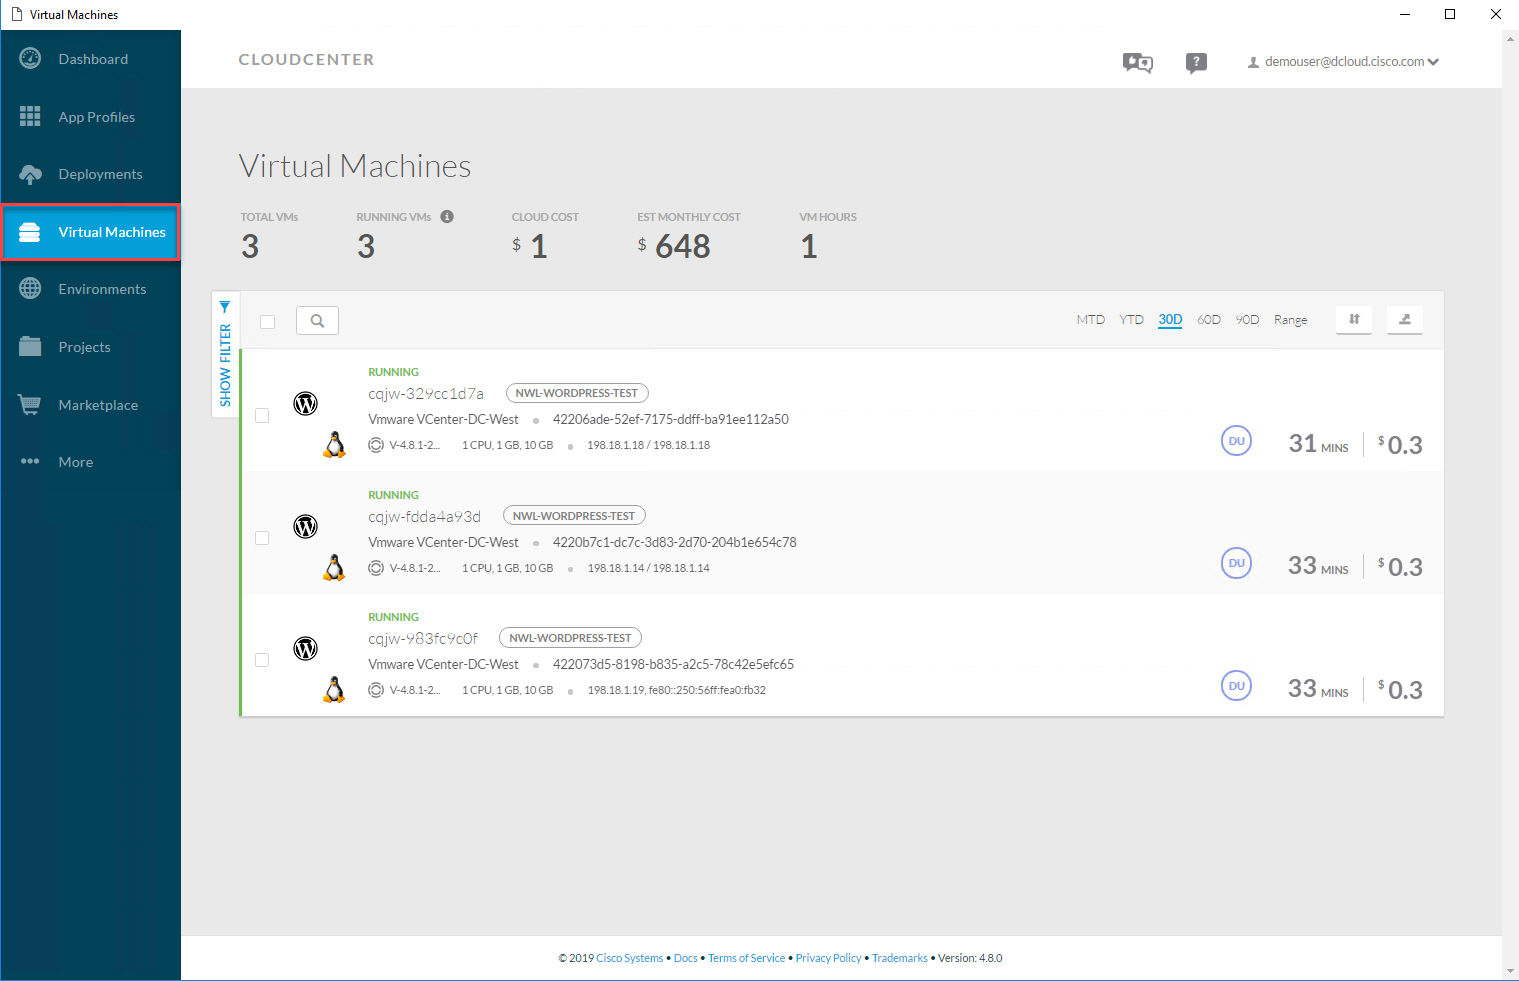
This shows me the virtual machines where HAProxy, Apache, and MySQL run. We deployed an application and the end user doesn’t have to worry about the underlying infrastructure.
Administrator
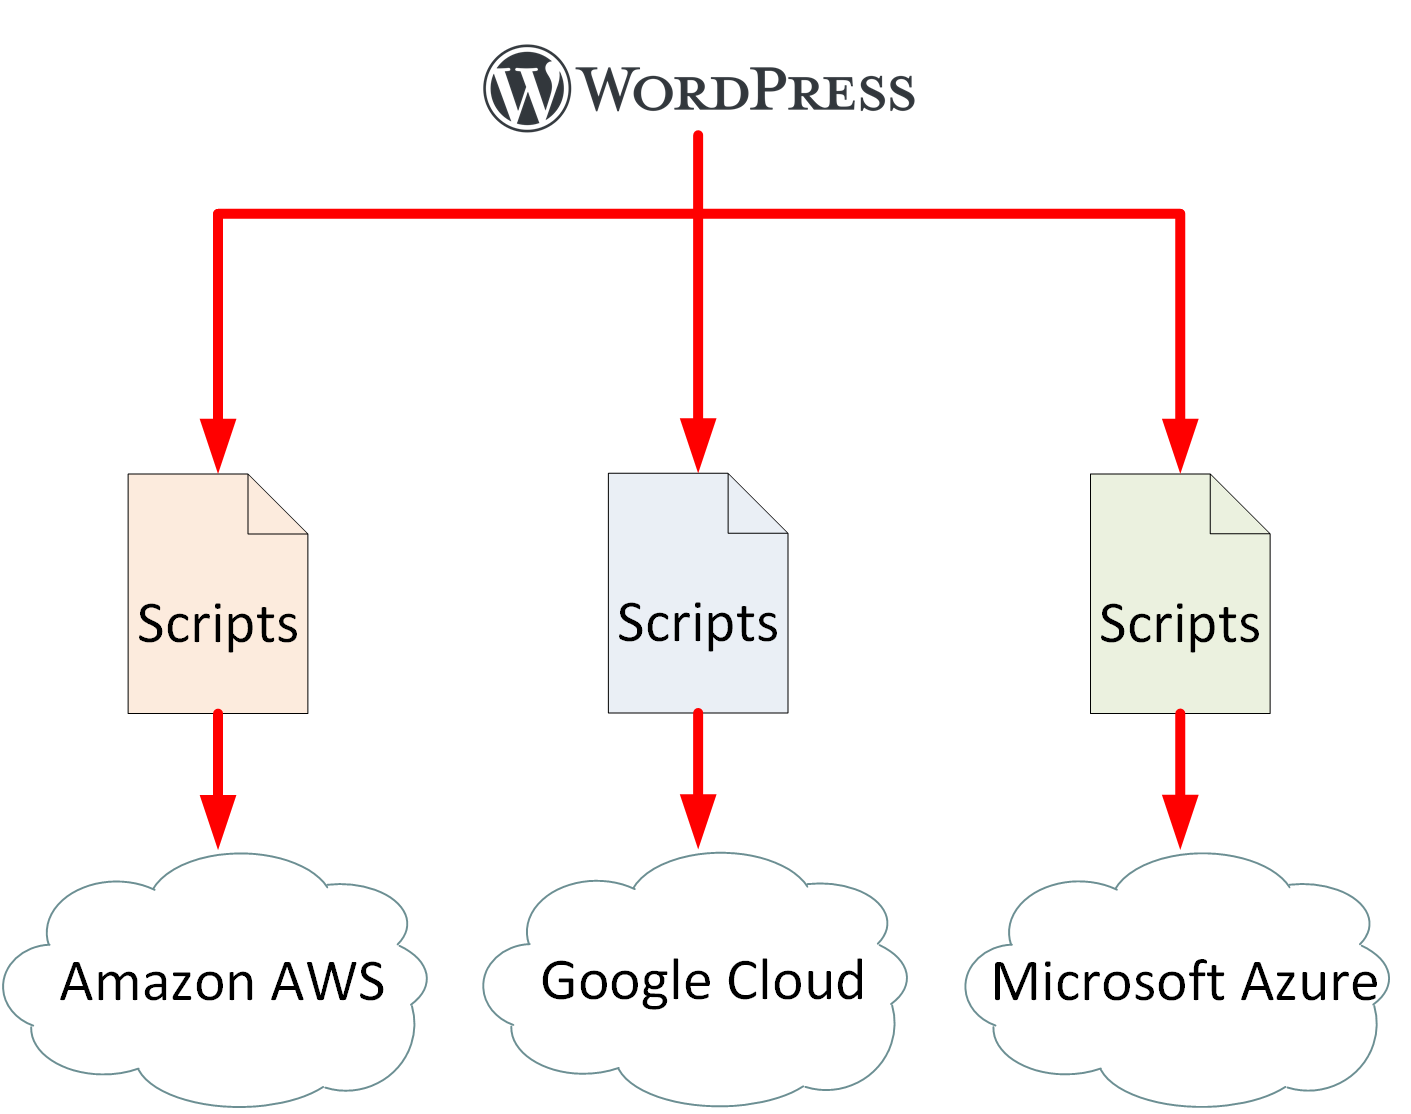
Let’s look at an example for administrators. In the application profile overview, you can create a new application or edit an existing one. Let’s look at the WordPress application:

This gives me access to the topology modeler. I can click and drag the components I need and connect them to each other:
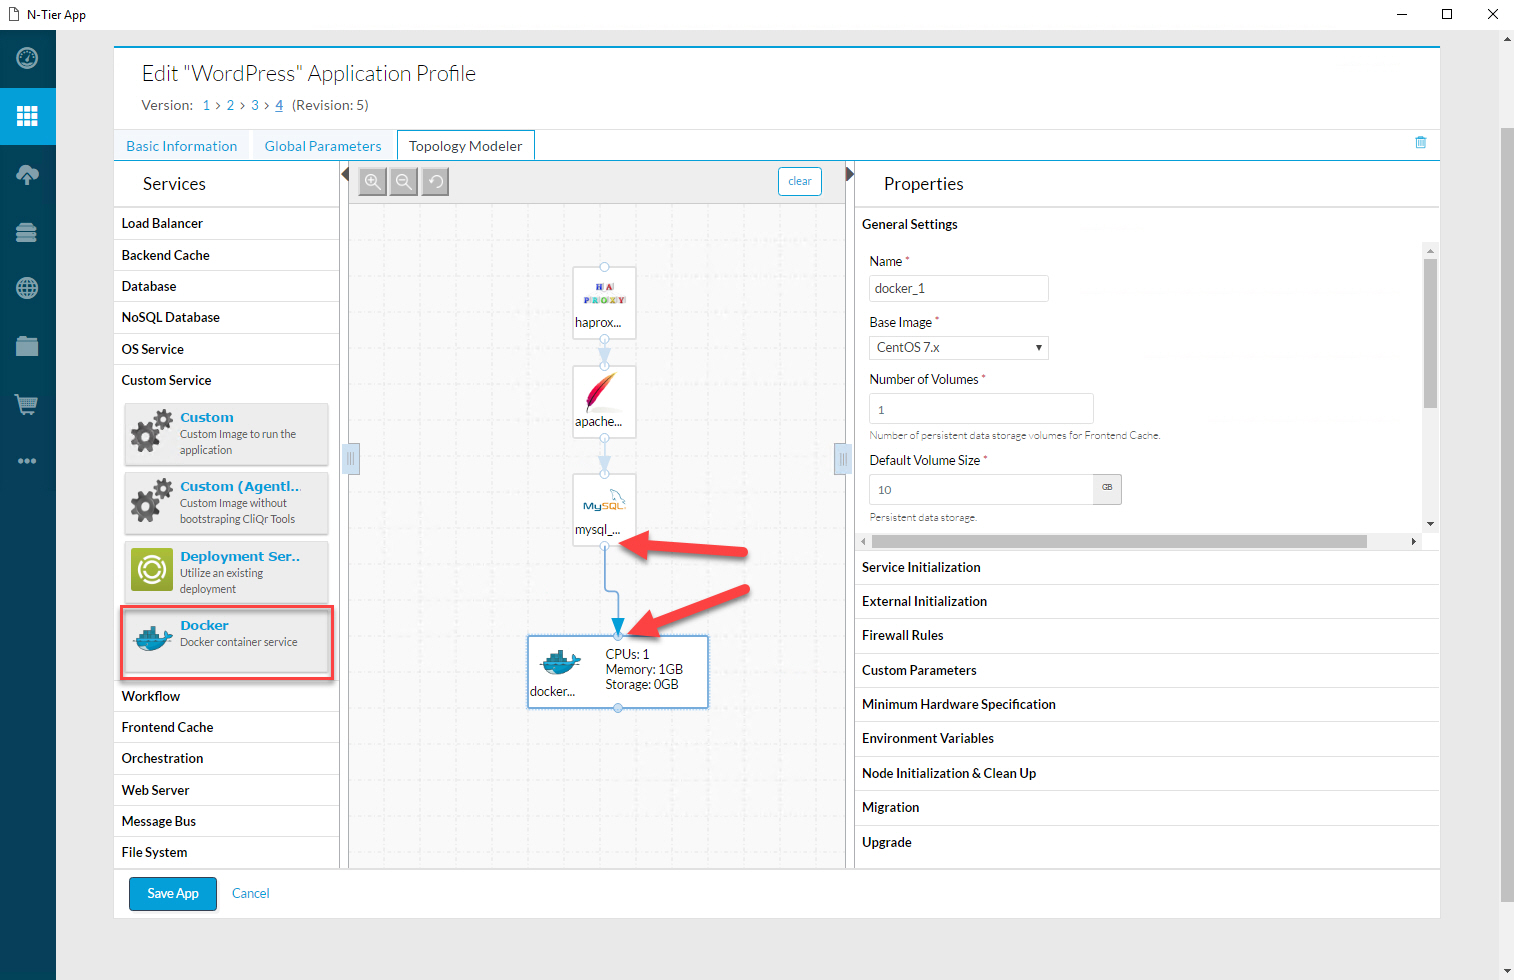
Administrators can design the entire application like this, without worrying about the specifics of how Amazon AWS, Google Cloud, Azure, VMWare Vsphere, or any other infrastructure components work.
Conclusion
You have learned about the basics of network automation and orchestration:
- Manually creating and launching VMs, containers, and network devices is not the best idea because:
- It is too time consuming.
- It’s easy to make errors.
- It’s not scalable.
- Network automation and orchestration are better options:
- With network automation we automate tasks so they run on their own without human intervention.
- Orchestration is the automated configuration, coordination, and management of computer systems and software:
- We describe what we want, not how we want it. That’s the job of the orchestrator.
- You have seen how you can use Ansible for network automation.
- You learned about Kubernetes, the most popular orchestration tool for containers.
- You learned about Cisco CloudCenter, an application orchestration tool that lets you deploy applications without worrying about the underlying infrastructure:
- on-premises data center
- private cloud
- public cloud
I hope you enjoyed this lesson. If you have any questions, please leave a comment.
No comments:
Post a Comment